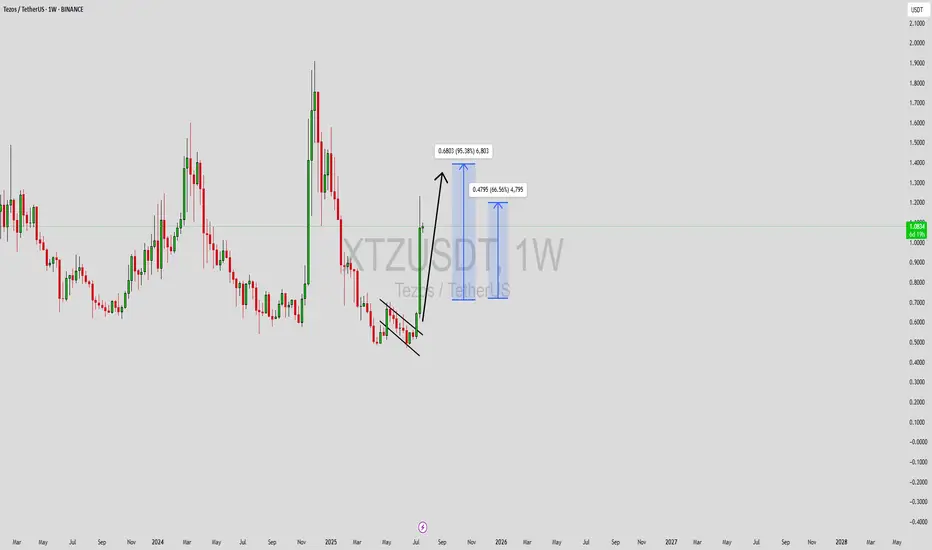
XTZUSDT Forming Falling WedgeXTZUSDT (Tezos/USDT) has recently broken out of a classic falling wedge pattern on the weekly chart, a bullish structure that often signals a strong upward reversal. After a prolonged period of consolidation and accumulation, the breakout is now supported by increasing volume, indicating renewed investor interest and possible institutional attention. Technically, the pattern breakout confirms the end of the downtrend and suggests a strong bullish impulse may follow.
The current market structure indicates a potential price rally of around 80% to 90% from the breakout level, with clear upside targets shown in the chart. The bullish candle formation following the wedge breakout is backed by a volume surge, adding further confirmation that buyers are stepping in. If this momentum continues, XTZ could challenge previous resistance levels and attract additional buyers along the way, especially swing traders looking for mid-term breakout plays.
With Tezos’ underlying technology being focused on scalable smart contracts and self-upgrading blockchain architecture, the project continues to attract attention in the decentralized finance (DeFi) and NFT sectors. As interest in fundamentally strong Layer 1 blockchains returns during market recovery phases, XTZ becomes a favorable candidate for both technical and fundamental investors alike.
✅ Show your support by hitting the like button and
✅ Leaving a comment below! (What is You opinion about this Coin)
Your feedback and engagement keep me inspired to share more insightful market analysis with you!
Xtzlong
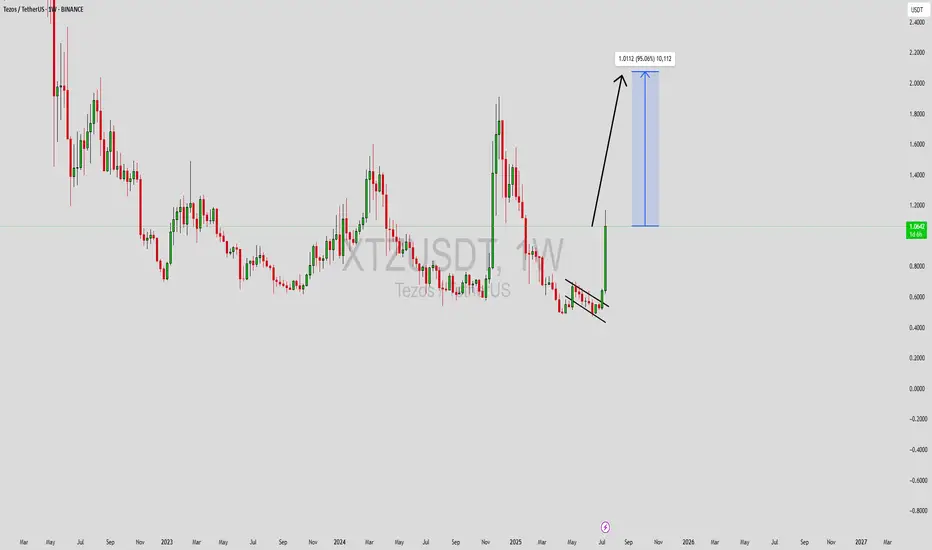
XTZUSDT Forming Falling WedgeXTZUSDT has recently formed a classic falling wedge pattern on the daily timeframe, a setup often associated with bullish reversals. This technical formation, marked by converging downward sloping trendlines, is showing early signs of a breakout. With volume steadily building, a breakout confirmation above resistance could signal the beginning of a major bullish rally. Historically, falling wedge breakouts result in strong upside moves, and in this case, we are looking at a potential gain of 80% to 90% in the coming weeks.
Tezos (XTZ) has consistently positioned itself as a strong contender in the smart contract and decentralized applications (dApp) sector. With its self-amending blockchain and focus on governance, it continues to attract attention from developers and institutional players alike. As the broader crypto market shows signs of recovery, coins like XTZ that offer real-world utility and technical strength tend to lead the charge.
From a market sentiment perspective, interest in XTZ has been rising across social platforms and trading communities. The combination of technical alignment and positive fundamentals suggests that bulls are preparing for a strong move. Traders should keep an eye on breakout levels and monitor volume spikes as confirmation of momentum. A successful wedge breakout could bring XTZUSDT back to previous highs or even beyond.
✅ Show your support by hitting the like button and
✅ Leaving a comment below! (What is You opinion about this Coin)
Your feedback and engagement keep me inspired to share more insightful market analysis with you!
XTZ TEZOS SeekingPips says "Let Price Come To You" XTZUSDTezos Price LEVELS Identified.
Once again "HURRY UP AND WAIT"
⚠️ Subscribe To 🟢SeekingPips🟢 here on TradingView & get our latest CHART ANALYSIS FIRST

XTZ Tezos 7x? SeekingPips First Look! TIME & PRICE MEET?ℹ️As noted in the title Tezos XTZ is NOT something SeekingPips has had on his RADAR BUT....
You know by now that for 🟢SeekingPips🟢 PRICE is ALWAYS SECOND to TIME.
Our TIME FILTER BELLS are ringing HARD VERY HARD.
✅️Those of you who have been around SeekingPips for sometime KNOW WELL that I care not about any news or fundermental analysis, we are strictly MATH based TIME TRADERS in here so when the stars align and our TIME filters TRIGGER we sit up.
✅️You will know too that when 🟢SeekingPips🟢 decides to use a TRENDLINE that SeekingPips SEES SOMETHING COOKING.
✅️Also I just want to remind you that we only LONG CRYPTO. Any selling we do is strictly to bank something. Therefore the majority of our CRYPTO CHARTS will have a BULLISH BIAS.
⚠️However it DOES NOT MEAN that we necessarily have a valid trigger to enter the market at that moment a chart is shared.
⭐️We have our alerts ready and very clear key levels on the chart NOW WE SIT & WAIT and see how the LOWER TIMEFRAMES STRUCTURE develops around our TRENDLINE TO START.⭐️
No doubt we will have more to talk on this in the NEAR FUTURE.
✅️ SUBSCRIBE TO SeekingPips NOW SO YOU GET OUR ANALYSIS FIRST✅️

XTZUSDT: Buyers Could Step In Here! XTZUSDT: Buyers Could Step In Here! 🔥
This blue box marks a critical level where buyers might become active from multiple perspectives.
Key Confirmation Factors:
CDV spikes, lower timeframe upward structure breaks, buyer dominance on volume profile, and liquidation heatmaps showing fresh liquidity above.
Reactions here could be pivotal. Keep your strategy sharp and always confirm your entries.
Don’t just watch! Act! Boost, comment, and follow for more killer insights! 🚀
Let me tell you, this is something special. These insights, these setups—they’re not just good; they’re game-changers. I've spent years refining my approach, and the results speak for themselves. People are always asking, "How do you spot these opportunities?" It’s simple: experience, clarity, and a focus on high-probability moves.
Want to know how I use heatmaps, cumulative volume delta, and volume footprint techniques to find demand zones with precision? I’m happy to share—just send me a message. No cost, no catch. I believe in helping people make smarter decisions.
Here are some of my recent analyses. Each one highlights key opportunities:
🚀 GMTUSDT: %35 FAST REJECTION FROM THE RED BOX
🎯 ZENUSDT.P: Patience & Profitability | %230 Reaction from the Sniper Entry
🐶 DOGEUSDT.P: Next Move
🎨 RENDERUSDT.P: Opportunity of the Month
💎 ETHUSDT.P: Where to Retrace
🟢 BNBUSDT.P: Potential Surge
📊 BTC Dominance: Reaction Zone
🌊 WAVESUSDT.P: Demand Zone Potential
🟣 UNIUSDT.P: Long-Term Trade
🔵 XRPUSDT.P: Entry Zones
🔗 LINKUSDT.P: Follow The River
📈 BTCUSDT.P: Two Key Demand Zones
🟩 POLUSDT: Bullish Momentum
🌟 PENDLEUSDT.P: Where Opportunity Meets Precision
🔥 BTCUSDT.P: Liquidation of Highly Leveraged Longs
🌊 SOLUSDT.P: SOL's Dip - Your Opportunity
🐸 1000PEPEUSDT.P: Prime Bounce Zone Unlocked
🚀 ETHUSDT.P: Set to Explode - Don't Miss This Game Changer
🤖 IQUSDT: Smart Plan
⚡️ PONDUSDT: A Trade Not Taken Is Better Than a Losing One
💼 STMXUSDT: 2 Buying Areas
🐢 TURBOUSDT: Buy Zones and Buyer Presence
🌍 ICPUSDT.P: Massive Upside Potential | Check the Trade Update For Seeing Results
🟠 IDEXUSDT: Spot Buy Area | %26 Profit if You Trade with MSB
📌 USUALUSDT: Buyers Are Active + %70 Profit in Total
🌟 FORTHUSDT: Sniper Entry +%26 Reaction
🐳 QKCUSDT: Sniper Entry +%57 Reaction
📊 BTC.D: Retest of Key Area Highly Likely
This list? It’s just a small piece of what I’ve been working on. There’s so much more. Go check my profile, see the results for yourself. My goal is simple: provide value and help you win. If you’ve got questions, I’ve got answers. Let’s get to work!

#XTZ/USDT#XTZ
The price is moving in a 4-hour channel and sticking to it well
The price rebounded well from the lower border of its neck at the green support level of 0.910
We have a tendency to stabilize above the Moving Average 100
We have oversold resistance on the RSI indicator to support the rise, with a downtrend about to break higher
Entry price is 0.910
The first goal is 0.980
Second goal 1.053
Third goal 1.12
Fourth goal 1.20

Where To #XTZ/USDT?Can #XTZ Bulls defend the 0.6500 psychological level?
IMO: #XTZ/USDT could be the next interest for the bulls. Price crashed to a potential buy Liquidity zone. I am bullish

#XTZ
#XTZ
The price has been moving in a descending triangle since May 2023
The downtrend was breached
Moving average exceeded 100
Current price 1.062
First goal 1.312
Second goal 1.498
Third goal 1.762

XTZUSD - An Incredible RecoveryUsing previous highs and lows to plot a channel up where price will likely return to as this bear move ends.
The bars pattern in white is the parabolic run BTC from 2017, just showing how price could return to this upward area with a bullish move.
This coin could get pretty bullish once it gets out of this slump.

#XTZ/USDT#XTZ
The price has been moving in a descending triangle since May 2023
The downtrend was breached
Moving average exceeded 100
Current price 1.062
First goal 1.312
Second goal 1.498
Third goal 1.762

#XTZ/USDT#XTZ
The price has been moving in a descending triangle since May 2023
The downtrend was breached
Moving average exceeded 100
Current price 1.062
First goal 1.312
Second goal 1.498
Third goal 1.762

XTZ a possible Breakout XTZ shows a perfect Accumulation on both wave pattern and a support bounce at 0.94 areas.
If it crosses 1.06-1.08 with a proper market sentiment we can see it reach the previous resistance above mentioned In the chart. SL at 0.92 can be a good entry WEF BTC behaviour isnt bearish.

XTZETH - A Closing of Trend Lines Indicates One ThingTaking a look at Tezos and we can see clear trend lines both above and below the current market price - we've had some cracking trades through Crypto Tipster v2 over the last few months and years and this could well be another one!
After a little fakeout on the downside we're now trending back within the historical range with one target to aim for - the top of the trend range!
There's a few areas of resistance that we could be aiming for, but only one of these corresponds with that upper resistive trend line @ 8513.
This represents a very handsome 25% gain through until mid March sometime, we'll be sure to keep you guys updated with this one!
If you enjoyed or agree with this idea - drop us a comment, like & follow! :)

XTZBTC - Ranging in Channel, Moving UpwardTEZOS has been trending top to bottom in this descending channel for a while now, and we've recently tested been rejected by the lower edge once again, back to the top edge we go!
We've got a Buy signal from CTv2 to help confirm the upward move and should be able to lock in a good 15-20% on this one.
If you enjoyed or agree with this idea - drop us a comment, like & follow! :)


XTZ/USDT - LONG ----- Welcome, dear followers! -----
- Here is my trading methodology. I trade with a normal system and analysis of resistance and support, as well as price reversal patterns.
- For the record, I do not place a stop loss within my trades. So that I only risk 1.5% of my total capital in order to support the loss due to a price reversal against me.
- If a price reversed against my expectation and touched the drawn line r3, then I transferred targets to the entry point and waited for the price to close at it with a loss equal to almost zero.
- Today's deal is shown in the chart, and here are the entry and exit points below.
-- Support me with numbers and follow up on my account for other deals in the future. Thank you for coming to this part. --
-------------------------------------------------------
⚡️⚡️ XTZ/USDT ⚡️⚡️
Exchange: Binance Futures
Trade Type: Breakout (Long)
Leverage: Isolated (1.0X)
Entry Orders:
1) 1.417 - 100.0%
Take-Profit Orders:
1) 1.543 - 70.0%
2) 1.612 - 25.0%
3) 1.72 - 5.0%
Trailing Configuration:
Stop: Breakeven -
Trigger: Target (1)

XTZ/USDT :: Just follow the middle line !.XTZ/USDT :::
_ Currently, the middle line is playing the role of resistance, when this resistance is broken, it enters the $2 range .

Long order in for TEZOSI put a long in on Tezos, here's another opportunity for a long.
entry - whenever you want ( i entered in at 1.5386)
tp - 1.6110
SL (3% or 5% of your entry) ( my SL is at 1.4925)


XTZ Potential Reversal SoonXTZ is one of the most legit projects in the crypto space.
I have a short term price target of $1.86 and $3 by the end of the year.
Looking forward to read your opinion about it.

XTZUSD Comfortable UptrendConsistent higher lows can be seen on the left chart (coinbase)
Each one of these lows provides a unique support level
The uptrend isn't going anywhere
On the right I demonstrate how price is above a confirmed support level
This will lead to a bounce and return upwards
Bullish

XTZ Daily Review & 2 Possible StoriesXTZ at Daily chart is at very important place named " Liquidity Base "
thats the last base of compression
if it engulf this base we have sell story :)
our confirmation is william PR indicator and Cp moves up and strong weekly Supply above that works perfectly
but it can provides a good buy even it engulf the LqBase
helped by priceaction and RTM & ICT METHODS & ORDERFLOW & SMARTMONEY CONCEPT
sincerely BEARBOURSE

