XTZ gives a chance for another successful trade!Hello, Traders!
XTZ continues the consolidation phase in the range of $1.84 - $2.22
After the long-squeeze, we can observe the buyer's interest in the asset.
The value of the RSI indicator on the 12H timeframe drives out of the bearish zone.
Entry into the deal can be observed after the level of 0.382 of Fibonacci retracement in the range of $1.98-$2.08
The SL can be considered under $1.86
Price targets: $2.41 $2.65 $2.90
Good luck and watch out for the market!
P.S. This is not a piece of financial advice, but a trade I would be following myself
XTZUSD

Tezos - Decision PointTezos is reaching a critical decision point where long term ascending trendline meets shorter-term downtrend. With what seems like the precipice of alt-season, coupled with the strong price rebound and reclamation of said trendline after the at crash a few days ago, I'd expect XTZ to make an upward break and begin posting some strong gains going into 2021. Not to mention the EDO proposal, brigning zkSNARKS (privacy features) to Tezos, is on track to go live in February. Stars aligning.

XTZ at Support, Good Buying opportunity Tezos has tested the major support zone. XTZ has a very good community, and the team is continually working on the developments. After the breakout, XTZ will go like Waves. XTZ is a good coin for long term investment also.
Buy Zone: $1.85- $1.95 (add more in dips)
Target: $2.25- $2.45- $2.7- $2.95- $3.5- $3.8- $4.25
Tezos (XTZ) - December 26Hello?
Dear traders, nice to meet you.
"Like" is a huge force for me.
By "following" you can always get new information quickly.
Thank you for always supporting me.
-------------------------------------------------- -----
It rose while touching the 1.6066 point.
We need to see if it can rise along the uptrend line (2).
It remains to be seen if it can move above the 2.2080 point as it breaks off the short-term downtrend line.
Once supported at the 2.2080 point, further price increases are expected to lead to an attempt to break above the uptrend line (1).
If you get support from the 1.3336-1.6066 section, I think it's a good entry section.
-------------------------------------------------- -------------------------------------------
** All indicators are lagging indicators.
So, it's important to know that the indicator moves accordingly with the movement of price and volume.
Just for convenience, we are talking upside down for interpretation of the indicators.
** The wRSI_SR indicator is an indicator created by adding settings and options from the existing Stochastic RSI indicator. Hence, the interpretation is the same as the traditional Stochastic RSI indicator. (K, D line -> R, S line)
** CCI-RC indicator is an indicator created by changing the set value from the existing CCI indicator. Therefore, the interpretation is the same as the existing CCI indicator.
** Check support, resistance, and abbreviation points.
** Support or resistance is based on the closing price of the 1D chart.
** All explanations are for reference only and do not guarantee profit or loss on investment.
Explanation of abbreviations displayed on the chart
R: A point or section of resistance that requires a response to preserve profits
S-L: Stop-Loss point or section
S: A point or segment that can be bought for profit generation as a support point or segment
(Short-term Stop Loss can be said to be a point where profits and losses can be preserved or additionally entered through installment trading. You should trade from a short-term investment perspective.)


XTZ double bottoming on BTC pairAs you can see on the chart, its double bottoming soon. IMO, when its done this is gonna FLY HIGH.
On the USDT pair, its forming that nice 2nd parabolic bowl that we can see on many coins that already pop, especially King BTC.
Bought a bag at 2.30$ and got a buy order for a possible dip at 2.21$.


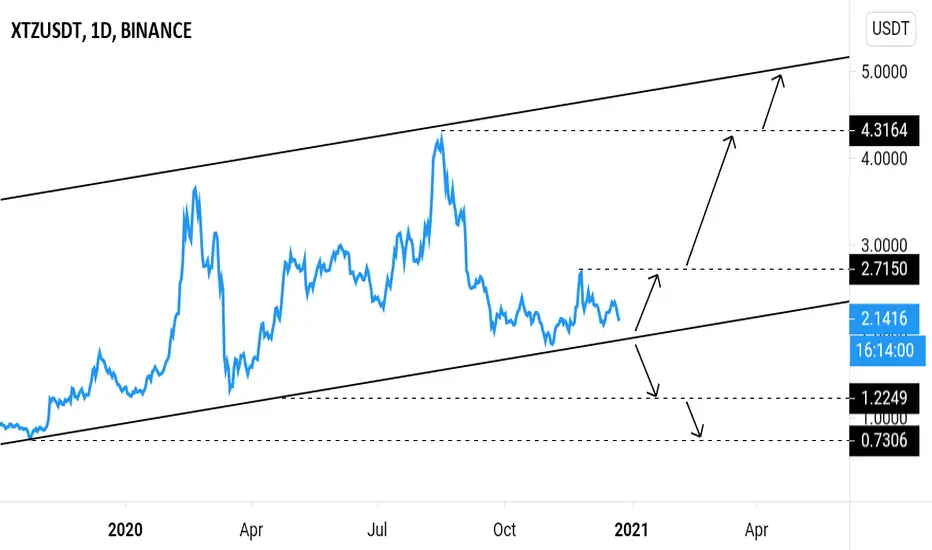
XTZUSDT - Daily analysis XTZUSDT is printing long term ascending channel.
Price 8s testing the channel support.
We could see a bounce off the support ⬆️ or a breakdown below the channel support ⬇️.
XTZ Tezos Bullish Wedge To Bullish Wedge RetestMan, sometimes i can be such an idiot :). I noticed yesterday that i accidently posted 3 analysis as a hidden post, then i posted all of them again as a normal post, now i am seeing i posted this one twice as a hidden post :),
One would say, if there was a moment for alts to rally, it would be now with Bitcoins big ATH breakout. But why are most of them barely moving? The big alts like ETH and LTC and a few more did move quite a bit, but i see that many of the smaller ones (didn't check all of them). I don't have a theory on why this is, but as during most rallies since 2019, most of the worlds eyes are on Bitcoin and not on the rest.
So even though the setup is here for Tezos, i honestly don't know if it will play out or not, but there is potential. On the right it looks like a bullish wedge, as long as it doesn't drop below the green box, the wedge is in play. The target of the small wedge is around 2.4. The big question though is, if this small wedge plays out, is it just a small rally until the 2.4 or will we see those old school pumps like we saw in the past? For that, it's important to see it pump past that 2.4 target. So reaching the 2.6/2.7, if that would happen, then more would be possible for the coming weeks/months.
The hidden post:
Previous analysis:

Tezos (XTZ) - December 19Good morning?
Dear traders, nice to meet you.
"Like" is a huge force for me.
By "following" you can always get new information quickly.
Thank you for always supporting me.
-------------------------------------------------- -----
We have to see if we can get support at 2.2080 and climb above 2.4821.
If supported at 2.4821, it is a possible entry point to break above the uptrend line (1).
If it falls from the 2.2080 point, it is a short-term stop loss.
We must see if we can break above the uptrend line (1) and touch the 3.3269 point.
The key is whether it can break above the 2.8221 point.
-------------------------------------------------- -------------------------------------------
** All indicators are lagging indicators.
So, it's important to know that the indicator moves accordingly with the movement of price and volume.
Just for convenience, we are talking upside down to interpret the indicators.
** Check support, resistance, and abbreviation points.
** Support or resistance is based on the closing price of the 1D chart.
** All explanations are for reference only and do not guarantee profit or loss on investment.
Explanation of abbreviations displayed on the chart
R: A point or section of resistance that requires a response to preserve profits
S-L: Stop-Loss point or section
S: A point or segment that can be bought for profit generation as a support point or segment
(Short-term Stop Loss can be said to be a point where profits and losses can be preserved or additionally entered through installment trading. You should trade from a short-term investment perspective.)

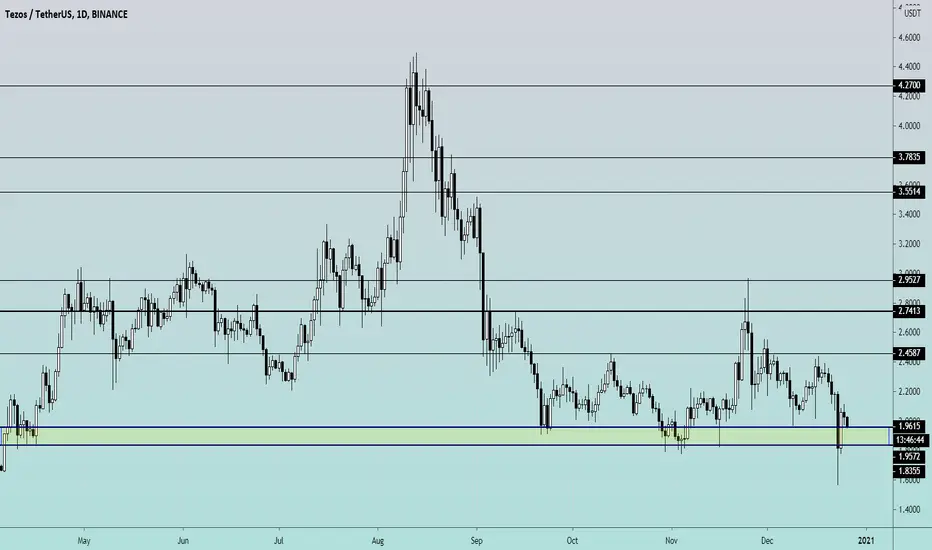
XTZ 12h An aggressive buyer appears on the chart, we are waitingIt looks like XTZ has finally started buying back.
In the previous ideas, we wrote that the uncorrected fall of XTZUSDT is scary. However, the buy back began from the zone which we had marked on the chart a long time ago.
Since then, the price has never lowered to $1.78.
Looking at the chart, you can see that for the last month someone aggressively buys out XTZ as soon as it approaches $2.
It is likely that in the coming days, the buy back level will be raised to $2.20.
Growth up to $3.20 is our priority.
The priority and the situation on the chart will change if the price can fix below $2.
_______________________________
Since 2016 , we have been analyzing and trading the cryptocurrency market.
We transform our knowledge, trading moods and experience into ideas. Each "like under the idea" boosts the level of our happiness by 0.05%. If we help you to be calmer and richer - help us to be happier :)

XTZ - NEXT MOVEA nice and easy short action on this correction of this parabolic ascending channel.
Bitcoin done exactly the same yesterday evening.
Sell the next top of the channel and close your position at the goal. Simple.

XTZUSD - FallingWedge Breakout (4HR Timeframe)Breakout of the FallingWedge and clear support from the year long trendline support, so good chance we see continuation to the upside as long as Bitcoin holds steady.
The level I'm watching is the $2.60 region since it was previous resistance multiple times, as well a previous target of a bigger FallingWedge seen 2 months beforehand.
It's also possible for us to reach and test the $3.00 regions in the future, and eventually testing the upper support of the year long trend, though it is too far out to analyze for the meantime. Also, if the price stalls too long in it's current area of $2.35, then that may be a bad sign as well, we need a big push.

XTZUSD 1DResistance around 2.3 is broken.
OBV looks good, have to see if it holds or breaks downwards.

XTZ big move coming! XTZ price has been steadily moving while btc xtz pair has been moving down. Due to sudden spike in BTC, holders are moving out of xtz into btc. This has landed xtz in the oversold zone by a good margin. When BTC begins to move back to xtz price will spike. MACD will make cross above center line within about week I believe signaling trend reversal. But the bottom would most likely be now.
what are your thoughts?
peace

XTZ/USD (round 2) :)XTZ/USD round 2
XTZ has had a massive sold off after our date of 10th August 2020.
Now is at an interesting level for holders to reaccumulate, anyhow, if you are already in , you will see 2 interesting targets in red (TP1, TP2) to redistribute/sell.
With a DAILY close above the black resistance at around 4.492 would activate the much more ambitious targets.
An eventual fall and close below 2.32 would activate the 2 buys in green.
Good Luck :)
LSMTS


XTZ BTC pair about to run. 2.50 -> 3.00 -> 3.50 usdlooking at the weekly xtz btc pair, price has touched the bottom twice and is leveling out. Moving average is leveling out, RSI is just touching the floor of being over-sold and volume has created higher low on the oscillator.
Signs point to a strong move upward within a week to a week and a half. This chart also validates an evaluation I did recently on XTZ USD pair I'll share below.
Again, be aware that if BTC has a strong correction that XTZ and others will most likely follow. I expect that XTZ would move up very sharply after this correction if not before.
There is money to be made, and greed is a relentless task master. So I think price will go up.
Friends do not trade with your gas money, buy gas with your gas money and trade with your cigarette money..
Peace

TEZOS - 3 KEY LONG-TERM TARGETSThis is a solid long term buying opportunity as it seems that the altcoin season has finally started. I'd expect it to be a fast uptrend, lasting 1-3 months.

XTZ at the bottom 2.50 -> 5.00 -> 8.00looking at daily chart and marking support/resistance zones. XTZ is staying in upward channel. could take a couple months to reach new highs, but if you were going to buy at the bottom and hold, the signals emphasize now to be a good time. Possible that we could see 1.85 before moving up but the risk/reward on the long term target is very good.

XTZ ready to go back upIF XTZ breaks it previous local high look for the two targets mentioned. SL is below the support line.


XTZLooks like W as well. Many alts look the same. Seriously just throw a dart hold and make money soon.
