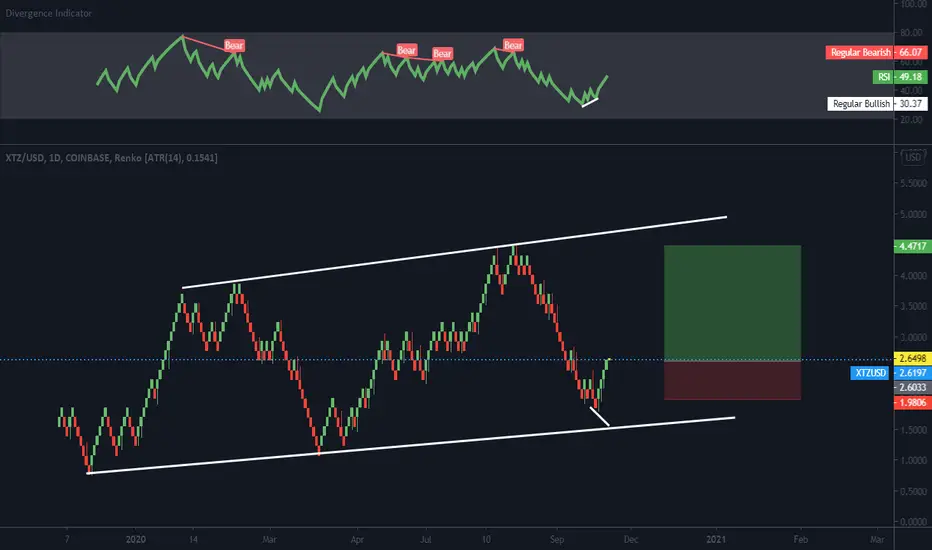
XTZ bound to retest all time high?Bullish divergence a few days ago. Resistance around $4.5 while support at $1.98.
Risk reward ratio seems attractive at 3, with possible gain of 71% if 4.5 got hit and possible loss of 24% if stopped out at 1.98.
Trade Cautiously.
XTZUSD


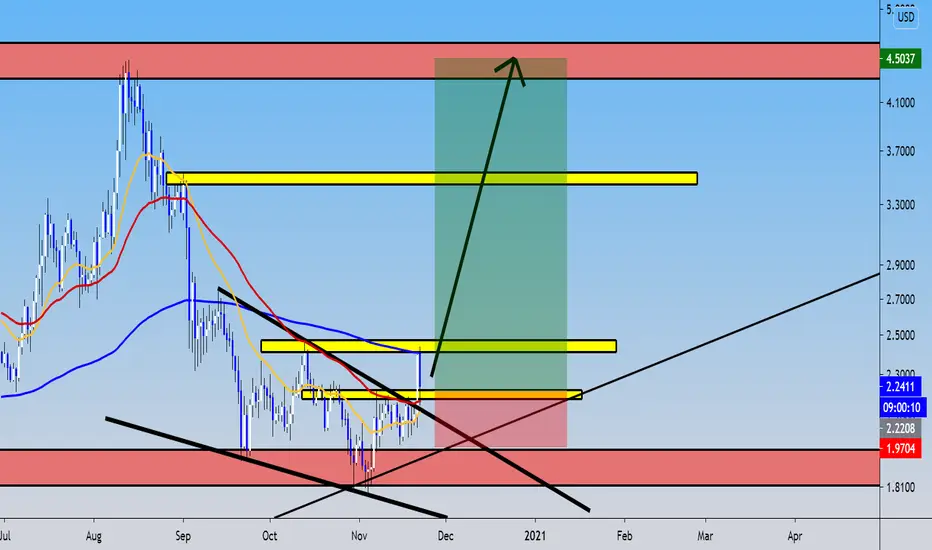
$XTZ, Waking up after 3 months of ranging (accumulating?)$XTZ
Waking up after 3 months of ranging (accumulating?)
If everything is doing a new 2020 ATH, why this one not?😁
Volume spiked as its crossing over ~2.28$ resistance w/ UCTS 1/2D buy
If manage to hold/flip then we can start seeing more upside on the following days.
#XTZ

✳️Tezos/USDT (8/11) View + Trading Plan #XTZ $XTZAfter breaking out of the 1.9$ zone, XTZ quickly turned back and closed the 1D candle above the 2$ zone and this is a good sign that the 1.9-2$ zone is very important for XTZ and it can push the XTZ up strongly in this November.
The heading targets will be the 2.5$ and 3.5$ zones
However, if the 1.9-2$ zone continues to fail, there is still a very strong support zone at 1.5-1.6$
📈BUY- LONG
- Buy: 1.9-2$, stoploss if B
📉SELL-SHORT
- Sell: 2.5-2.6$, stoploss if A
- Sell: 3.4-3.5$, stoploss if A
♻️BACK-UP
- Buy: 1.5-1.6$, stoploss if B
- Sell close to 1.9-2$ if B, stoploss if A
❓Details:
Condition A : "If 1D candle closes ABOVE this zone"
Condition B : "If 1D candle closes BELOW this zone"


Update: Tezos confirm the support of the good zone of bought!!!
Tezos could to form a new bull cycle using the model of the Elliot Wave Analysis.
Now, in Daily, we're in the good point of bought Tezos!!! I'm buy Tezos right now!!!
Good luck in this position!!!
Still Alert on Tezos for the next profits!!!Hello, I make this analysis on Tezos as trading idea for you. So, we see in Daily that Tezos was formed an bullish rising wedge, so I hope a bought approximately at $2.25 USD in the next few hours. So, I will going to continue following this technical analysis, at the moment, it's a trade!!!
So, I decide to add a little bought of simply 500 XTZ. Notice one thing, Tezos it's a good cryptocurrency to invest in long term.
We can to mark this 3 targets to reach in Tezos for our investments. Also, noticed that this proyect it's so curios and so unique in their kind that this crypto it's into my favorite for invest!!!
So, I will going to bought 500 XTZ for long term as contract in my Quantfury App, at the same time that I have NEO and ADA in earning right now for hold by contract to multiply your trading knowing when and where to invest.
So, it's all, if you like this idea, please get me a like and share this idea with your traders and friends.
So guys, I dind't sell any crytpo because if you know, the new ATH wealth transfer it's comming in the next months. For that reasn, I invite you to know the Quantfury app, to invest in crypto as the same time make trading in cryptos.
I invite you also to check my fundamental analysis of Tezos. Remember Tezos it's into my list to invest!!!

Tezos (XTZ) - November 18Hello?
Dear traders, nice to meet you.
"Like" is a huge force for me.
By "following" you can always get new information quickly.
Thank you for always supporting me.
-------------------------------------------------- -----
We have to climb above 2.2080 to gain support and see if we can ascend.
If it falls at 2.1072, it is a short-term Stop Loss.
It remains to be seen if there can be any movement to reverse the trend.
-------------------------------------------------- -------------------------------------------
** Check support, resistance, and abbreviation points.
** Support or resistance is based on the closing price of the 1D chart.
** All explanations are for reference only and do not guarantee profit or loss on investment.
Explanation of abbreviations displayed on the chart
R: A point or section of resistance that requires a response to preserve profits
S-L: Stop-Loss point or section
S: A point or segment that can be bought for profit generation as a support point or segment
(Short-term Stop Loss can be said to be a point where profits and losses can be preserved or additionally entered through installment trading. You should trade from a short-term investment perspective.)


XTZ/USDT - end of the accumulation phase +55% potential tradeHello, Traders!
Tezos has passed the correction phase and finishes the accumulation phase in the range of $1.84-2.22.
Typically, an exit from such an accumulation does not end with a small upward movement, so we have a chance to take part in the emerging upward movement!
We can consider entry in the deal in the range of $2,22-$2,28.
SL under 2.08 $
Fibonacci levels targets :
$2.82
$3.14
$3.46
Good luck and leave your feedback in the comments below.
P.S. This is not financial advice, just a trade I would be following myself

XTZ/USDT (Reversing From Support Zone)XTZ/USDT currently trading at $2.12
LONG ENTRY: Above $2.24(Only Enter Long After 1 days candle close Above Resistance level at $2.24)
STOP LOSS ( support): Below $1.75
Resistance level 1(Target) : $2.66
Resistance Level 2(Target): $3.00
Resistance Level 3(Target): $3.86
Resistance Level 4(Target):$ 4.44
Max Leverage: 5X
ALWAYS KEEP STOP LOSS...
Please Like, Share and Comment your thoughts

XTZ Move SoonXTZ getting squeezed on the daily, can expect a breakout to the upside or downside. If BTC holds strong I expect it to be to the upside and probably a nice pump since XTZ has been slowly dying off since early September. Hope you found it useful, Good Luck!!


XTZUSD to see an uptrend(1D) | MACD Bullish | Midline SupportMarket in last 1 week
XTZUSD saw a sideways movement with the price riding the midline Bollinger band
Price volatility was very high. The market moved ~11.01%, between $2.200 and $1.9817
Today’s Trend analysis
XTZUSD expected to see an uptrend as the price after riding the midline band got midline support
Price at time of publishing: $2.1269
XTZ’s market cap: $1.59 Billion
Oscillator indicators are mostly neutral. RSI at 52
Moving average indicators are biased towards an uptrend. Ichimoku Cloud is neutral and Hull MA indicates a buying opportunity
Volume indicators saw a decrease in volume with price moving sideways while volume started to increase as price saw a decline
Price expected to see an uptrend as the price after riding the midline band got midline support. Most of the Oscillator indicators are neutral. MACD line moving above the signal line with histogram size decreasing in the positive region, suggesting a bullish bias. RSI at 52, close to the midline in the neutral region. CCI is around 77, in the neutral region with a slight upmove. Another interesting point to notice here is that volume saw a decrease in volume with price moving sideways while volume started to increase as price saw a decline indicating a shift from buyers to sellers.
----------------------------------------------------------------------------------------
The analysis is based on signals from 28 technical indicators, out of which 17 are moving averages and remaining 11 are oscillators. These indicator values are calculated using 1 D candles.
Note: Above analysis would hold true if we do not encounter a sudden jump in trade volume .
----------------------------------------------------------------------------------------
If you find the analysis useful, please like and share our ideas with the community!
- Mudrex

XTZ/USD Bottom of Year Long Channel Long-term $4.90 TargetShowing bullish divergence at the bottom of the channel.


XTZ 1D In search of a compromise priceThe previous idea work out, though it took a long time, but in the end the targets worked out well.
After a rapid and almost uncorrected fall for 2 months, sellers slowed down.
The price starts looking for an equilibrium value that would interest both buyers and sellers.
In the current situation, a smooth slope is more real, first to the liquid zone $1.72-1.76 and possible a sharp collection of stops to $1.62.
If the price fixes above $2.20 , then the way for growth to the zone $2.45-2.50 will be opened.
__________________________
Each " like under the idea" boosts the level of our happiness by 0.05% . If we help you to be calmer and richer - help us to be happier :)

XTZUSD H4: Best Level to BUY IT 10% gains(SL/TP)(NEW)Why get subbed to me on Tradingview?
-TOP author on TradingView
-15+ years experience in markets
-Professional chart break downs
-Supply/Demand Zones
-TD9 counts / combo review
-Key S/R levels
-No junk on my charts
-Frequent updates
-Covering FX/crypto/US stocks
-24/7 uptime so constant updates
XTZUSD H4: Best Level to BUY IT 10% gains(SL/TP)(NEW)
IMPORTANT NOTE: speculative setup. do your own
due dill. use STOP LOSS. don't overleverage.
Tagged as SHORT because I expect short-term
losses in this market.
🔸 Summary and potential trade setup
::: XTZUSD 4hour chart review/outlook
::: V-shape in progress
::: 10% upside still remains
::: heavy resistance overhead 2.40 USD
::: some upside still remains BUY/HOLD
::: just market buy and hold it
::: BULL still got a reason to hold
::: 2 key s/r levels overhead may
::: cause trouble. 2.30/2.40 USD
::: recommended strategy: BUY/HOLD
::: TP BULLS +10% gains
::: correction mode soon
::: good luck traders!
::: SHORT IT and get paid. period.
🔸 Supply/Demand Zones
::: N/A
::: N/A
🔸 Other noteworthy technicals/fundies
::: TD9 /Combo update: N/A
::: Sentiment mid-term: BULLS/10%
::: Sentiment outlook short-term: BULLS

XTZUSDT - buy from levelpreconditions for a false sample.
- False breakdown LOW 1.8$
- Reaction from the level.
- Buyer bought back the seller.
- Breakdown of the tilt is added to the position.
- Take profit set by the zone.


XTZ USD channel still holdingThis channel on the XTZUSD pair is still holding. For a larger move to happen in the near term, we need this area to hold. This could ratify this larger channel pattern and would send us higher.
While on the XTZ/BTC pair we can see where RSI has hit it's lower bound every time but 2 it has rebounded. I still think we are poised for a sharper move up in the near time with BTC and ETH being so bullish.
Cheers,
-Sherem

XTZ on the next Bitcoin $250k Peak with three possible pricesXtz on three possible price points going into the next Bitcoin Bull Run 2023. Keep in mind Tezos is a baby platform but with a massive war chest of over $600 million from their ICO. They are a likely candidate like Cardano to displace Ethereum as the number two in crypto rankings. Tezos has brilliant coders/programmers and tackling the STO market which will be a massive shift from conventional Wall Street markets. This is a gem waiting to explode. The three price targets I have her are between $250.00 up to $2,500.00. Please keep in mind that this is only my opinion and I am basing this on the current trendline trajectory that is apparent on this three-year chart.
