An update/followup on the tezos inverse head & shoulder pattern Much like the algo chart, tezos has formed an inverse head in shoulders inside a slightly bigger inverse head and shoulders and now has 2 necklines which means 2 breakout targets. Still developing for now but it appears the it is confirming the first pink neckline as support here. *not financial advice*
XTZUSD

XTZ - 2x OpportunityReposting this since the last chart was removed for some kind of infraction.
Since we reached the level at which I said it's a good idea to accumulate, I thought I'd provide an update with a prediction of where the price can go next. Keep in mind that if you bought here, the best time to sell is end of 2025, but if you want an earlier mid-term target then I think I have a trigger and a set-up for you.
If the price retraces all of the FTX dump and closes above $1.4, then I can see it squeeze up to the area highlighted in red in the chart ($2.8 - $3.2). That means one can buy at 1.4 and 2x within a few months. As I'm sure you all now know, that's pretty much as good as it gets during a bear market. It may even be asking a lot. Keep in mind that if that level is lost, if the price closes below, then this prediction is invalidated. What I mean is that my prediction holds only if we get to and stay above $1.4.
This doesn't just go for XTZ. It's like this for all other altcoins, and includes BTC, too. If they close above the point at which the market began dumping on news from FTX , then they're likely to pump hard. I intend to post a few more charts showing what I mean.
I've been bearish the whole way down, but I think the bear is starting to finally hibernate, and the bulls are beginning to wake up. It'll be slow at first until mid-2024, and then, after the halving, we'll see the bulls rampage again.

XTZ/USD - 2018 bearschizo bros rise up!If we get the brutal 3 year bear run, these are the levels I plan on buying XTZ. Veterans of last bear run would not be shocked if we saw 90-98% drops on major coins, regardless of their fundamentals. Even ETH dumped 94% last time.
This is one of my contingency plans - obviously not advising anyone to follow suit. I still have some alt suicide bags. That said, in my opinion it is a good idea to have cash handy for these possibilities.
Blue - dip toes
Green - long accumulation
Purple - buy with size
(exception is if the project dies, otherwise I think these bags would make me a happy man in the next bull run, especially with baking.)

XTZUSD bear flag 50 % dropXTZUSD is forming the bear flag .
It doesn´t look like xtz formed the bottom like other altcoins did therefore we expect the bear flag to break down.
Speculative setup:
- price in a distribution mode
- wait for a break down to enter the trade
- target: 1 $


Say bye to Tezos $XTZXTZ has been building.
Re-test off this bullish flag type scenrio could finally see a breakout on all time frames!
as usual SEND IT

XTZ , Moving towards the resistance zonePrice previously filled the imbalance around $1.48 and moved down from there. I now expect it to keep moving down towards the 30mins demand zone around $1.31 where we would be looking to long from.


If tezos can flip the 50dma 2 support the invh&s should validateNeed to flip this orange 50 daily moving average to solid support and then we can validate the inverse head and shoulder breakout and head to this target. *not financial advice*

XTZ/USDT - LONG ----- Welcome, dear followers! -----
- Here is my trading methodology. I trade with a normal system and analysis of resistance and support, as well as price reversal patterns.
- For the record, I do not place a stop loss within my trades. So that I only risk 1.5% of my total capital in order to support the loss due to a price reversal against me.
- If a price reversed against my expectation and touched the drawn line r3, then I transferred targets to the entry point and waited for the price to close at it with a loss equal to almost zero.
- Today's deal is shown in the chart, and here are the entry and exit points below.
-- Support me with numbers and follow up on my account for other deals in the future. Thank you for coming to this part. --
-------------------------------------------------------
⚡️⚡️ XTZ/USDT ⚡️⚡️
Exchange: Binance Futures
Trade Type: Breakout (Long)
Leverage: Isolated (1.0X)
Entry Orders:
1) 1.417 - 100.0%
Take-Profit Orders:
1) 1.543 - 70.0%
2) 1.612 - 25.0%
3) 1.72 - 5.0%
Trailing Configuration:
Stop: Breakeven -
Trigger: Target (1)

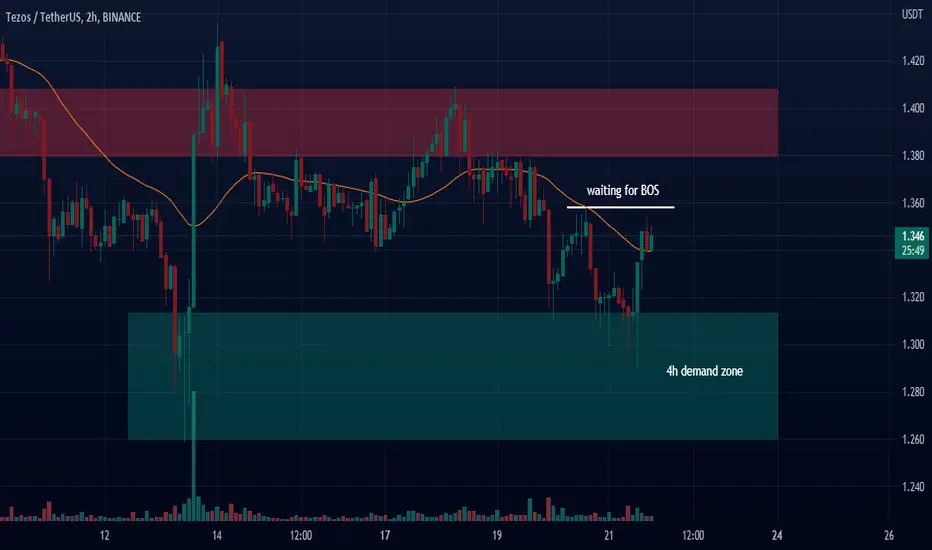
I am waiting for XTZ price to give a clear breakPrice bounced off the 4h demand zone as predicted. I am waiting for price to give a clear break of structure above the previous high before going long for confirmation.

🟢 XTZUSDT - 4H (19.09.2022)🟢 XTZUSDT
TF: 4H
Side: Long
Pattern: Double Bottom + Bull Flag
Entry: $1.4329
SL: $1.4010
TP 1: $1.4912
TP 2: $1.5420
TP 3: $1.5831
TP 4: $1.6242
This thing will fly as it's at strong support now.

$XTZ : Dead Cat Bounce?Based on fractals on the green box, I'm expecting $XTZ rally up before drops to demand zone marked by red line

XTZUSDT Long SignalXTZUSDT has made some clear moves in the near-past and it has confirmed the Short term confirmation, which is clearly seen in the chart. It's just a matter of time for it to gain momentum and go sky-rocketing in the upward direction. I am fully bullish on XTZUSDT and currently my setup for $XTZ is as follows:
Entries : 1.21 - 1.40
One time Entry: 1.34
Short Term: 1.42 - 1.52 - 1.60 - 1.72 - 1.85 - 1.94
Mid Term: 2.10 - 2.48 - 2.93 - 3.58 - 4.72 - 6.08
1.08 - 1.02 (Trailing)
Please be aware with your money!

XTZUSD: long termXTZUSD: long term
The price is fixed below large volumes.
Perhaps the price will look for a new bottom before the end of the bear market.
If you like the idea, don't forget to subscribe and rate like👍

XTZ/USDT :: Just follow the middle line !.XTZ/USDT :::
_ Currently, the middle line is playing the role of resistance, when this resistance is broken, it enters the $2 range .


XTZUSD -2287Watch for a price action signal at 1.5602. Expect price to decrease 2287 from price level 1.5602.

#XTZ/USDT LONG TRADE SETUP #XTZ/USDT LONG TRADE SETUP
LONG ENTRY:-$1.59 - $1.61
STOPLOSS:-$1.56
TARGET:-7% TO 10%
LEVERAGE :-10X TO 20X
Remember:-This is not a piece of financial advice. All investment made by me is at my own risk and I am held responsible for my own profit and losses. So, do your own research before investing in this trade.
Do hit the like button if you like it and share your charts in the comments section.
Thank you.

Incoming $XTZ BreakoutAs we can see on 1H TF, both RSI and STDev are converging which suggest the dip might be in. Furthermore, its trading ranges maintained inside an ascending channel which suggest a bullish continuation. If breakout from $2 resistance zone takes place, we could possibly see a rally up to 161% fib retracement.

Incoming Tezos Bright SeasonAs we can se in 1W TF, $XTZ price range is still tightened on 50% - 61% fibonacci retracement range (see violet fib retracement). An upside breakout from yellow ascending triangle might be a catalyst to start $XTZ bright season.
