XTZUSDT-SHORTBased on technical factors there is a short position in :
XTZUSDT Tezos
Score 2️⃣
🔴Short Now or set on Key Level 4.015
🟢Target 1 3.690
🟢Target 2 3.390
🟢Target 3 2.750
❌Stop loss 4.115
#K_Level
Every signal has a score from 1 to 5, so accordingly adjust your risk for each signal. The signals with the score of 5 are the most probable ones.
Please support our activity with your likes and comments.
XTZUSD

💥TEZOS IS READY FOR 2X ROI TO $8🚀Please support this idea with a LIKE👍 if you find it useful🥳
Not a financial advice🙅🏼♂️
Price bounced back from the fourth support zone on the trendline and it’s currently heading to the upper trendline serving as resistance.
This right here is a confirmation that price is rising to $8.
What do you think?
Share your opinion in the comment section✍️
Follow me to receive more updates on TEZOS (XTZUSD ) 🤗
Happy Trading💰🥳🤗

TEZOS | Descending Channel Pattern..!!
#XTZ (Update)
Descending Channel Consolidation Continues..📉
So far Looks Bullish & In Case of Upside Breakout, expecting +100-120% Bullish Wave..
📍 Always Wait for Confirmed Breakout & Candle to Close and Only then ENTER..
Please like the idea for Support & Subscribe for More ideas like this and share your ideas and charts in Comments Section..!!
Thanks for Your Love & Support..!!

Xtz big opportunityEasy, everytime bigger.
Opened long position.
Weekly chart.
Buy at 3.44$ sell at 11$
In 4 weeks from now.
400% up
Everytime was bigger than the previous one.

XTZ Due For a Correction!?Tezos has been pushing up solidly recently from around january 26th we have been on a steady rise, we are currently trading inside of a rising wedge which is actually a bearish pattern and i believe we could be in for a healthy corrective move coming up soon. Don't get me wrong i am overall very bullish on Tezos in the longer term especially but i think we are due for a corrective move any day now. What im looking at is a possible false breakout of this rising wedge we have right now to the upside before coming back down quickly, this would effectively liquidate traders if we saw a move like this happen. Now if we look at our Mean Reversion channel we notice that our "mean" is below us about -15% currently, price tends to come back to this point sooner than later. Now another indication of a move like this happening is because we notice our top yellow/red band is right above the rising wedge, now this part indicates that price action is overbought-strong overbought, so playing back into my scenario with a false upside breakout landing us right in this overbought territory gives me more confirmation that a corrective move is coming. Now another reason is just due to the fact that we have seen very bullish price action recently, we have been steady moving to the upside with little to no corrective moves. Now what i am excited about here is that a move like this will provide yet another great buying and entry opportunity. Now lets look at the RSI, one thing is absolutely amazing, we are currently atleast on our 4H chart in a confirmed uptrend, this is shown by the RSI remaining above the midline for a decent amount of time, now another thing that plays into my prediction is that if we check a percentage drop on the RSI to a likely bounce support we actually line up perfectly with the same percentage as the mean is away from price action roughly 15-15.7%! Not financial advice just my opinion!

XTZ short setupTezos had a nice run over the past week but is still in a general downtrend and currently reaching a tough resistance area, which coincides with:
- 0.5 FIB level
- 50 EMA
- Low volume compared to the last big run in sep/21. This makes me confident in that we are more likely to see a move down.
Waiting for confirmation on the lower timeframes before entering

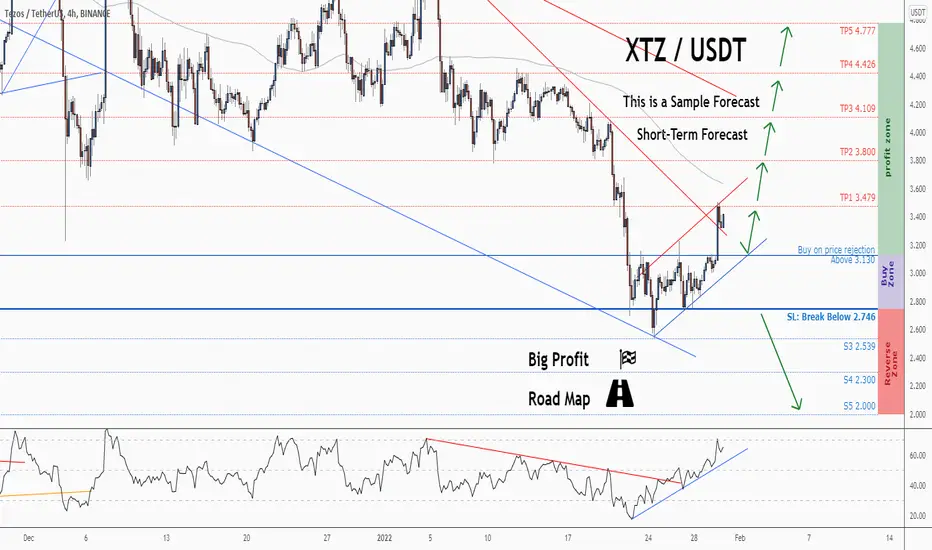
💡Don't miss the great buy opportunity in XTZUSD @tezosTrading suggestion:
". There is a possibility of temporary retracement to the suggested support line (3.130).
. if so, traders can set orders based on Price Action and expect to reach short-term targets."
Technical analysis:
. XTZUSD is in a range bound, and the beginning of an uptrend is expected.
. The price is below the 21-Day WEMA, which acts as a dynamic resistance.
. The RSI is at 64.
Take Profits:
TP1= @ 3.479
TP2= @ 3.800
TP3= @ 4.109
TP4= @ 4.426
TP5= @ 4.777
SL= Break below S2
❤️ If you find this helpful and want more FREE forecasts in TradingView
. . . . . Please show your support back,
. . . . . . . . Hit the 👍 LIKE button,
. . . . . . . . . . Drop some feedback below in the comment!
❤️ Your support is very much 🙏 appreciated!❤️
💎 Want us to help you become a better Forex / Crypto trader?
Now, It's your turn!
Be sure to leave a comment; let us know how you see this opportunity and forecast.
Trade well, ❤️
ForecastCity English Support Team ❤️
💡Don't miss the great buy opportunity in XTZUSD @tezosTrading suggestion:
". There is a possibility of temporary retracement to the suggested support line (3.130).
. if so, traders can set orders based on Price Action and expect to reach short-term targets."
Technical analysis:
. XTZUSD is in a range bound, and the beginning of an uptrend is expected.
. The price is below the 21-Day WEMA, which acts as a dynamic resistance.
. The RSI is at 64.
Take Profits:
TP1= @ 3.479
TP2= @ 3.800
TP3= @ 4.109
TP4= @ 4.426
TP5= @ 4.777
SL= Break below S2
❤️ If you find this helpful and want more FREE forecasts in TradingView
. . . . . Please show your support back,
. . . . . . . . Hit the 👍 LIKE button,
. . . . . . . . . . Drop some feedback below in the comment!
❤️ Your support is very much 🙏 appreciated! ❤️
💎 Want us to help you become a better Forex / Crypto trader ?
Now, It's your turn !
Be sure to leave a comment; let us know how you see this opportunity and forecast.
Trade well, ❤️
ForecastCity English Support Team ❤️

Tezos (XTZ) - January 25Hello?
Traders, welcome.
If you "follow", you can always get new information quickly.
Please also click "Like".
Have a nice day.
-------------------------------------
(XTZUSD 1W Chart)
(Full: )
1.8553 2069 point and above: uptrend expected to continue
4.0914 4691-4.4192 4300 or more: Expected to create a new wave.
You need to see if the uptrend can continue along the uptrend line.
A move above the 4.4192 4300 point is expected to accelerate the uptrend and find resistance at the 5.5738 1603-6.0233 4096 section.
If it goes down from the uptrend line, it is likely to drop below the 1.8553 2069 point, so trade cautiously.
-------------------------------------
(XTZBTC 1W Chart)
0.0001 4931-0.0001 7620 or higher: Expected to create a new wave.
Beginning in September 2021, the Bollinger Bands began to contract.
Therefore, a break from the downtrend line above the 0.0000 9730 point is expected to turn into an uptrend.
0.0000 6690-0.0001 4931 section is the bottom section.
------------------------------------------
We recommend that you trade with your average unit price.
This is because, if the price is below your average unit price, whether the price trend is in an upward trend or a downward trend, there is a high possibility that you will not be able to get a big profit due to the psychological burden.
The center of all trading starts with the average unit price at which you start trading.
If you ignore this, you may be trading in the wrong direction.
Therefore, it is important to find a way to lower the average unit price and adjust the proportion of the investment, ultimately allowing the funds corresponding to the profits to be able to regenerate themselves.
------------------------------------------------------------ -----------------------------------------------------
** All indicators are lagging indicators.
Therefore, it is important to be aware that the indicator will move accordingly as price and volume move.
However, for convenience, we are talking in reverse for the interpretation of the indicator.
** The MRHAB-O and MRHAB-B indicators used in the chart are indicators of our channel that have not been released yet.
(Since it was not disclosed, you can use this chart without any restrictions by sharing this chart and copying and pasting the indicators.)
** The wRSI_SR indicator is an indicator created by adding settings and options to the existing Stochastic RSI indicator.
Therefore, the interpretation is the same as the traditional Stochastic RSI indicator. (K, D line -> R, S line)
** The OBV indicator was re-created by applying a formula to the DepthHouse Trading indicator, an indicator disclosed by oh92. (Thanks for this.)
** Support or resistance is based on the closing price of the 1D chart.
** All descriptions are for reference only and do not guarantee a profit or loss in investment.
(Short-term Stop Loss can be said to be a point where profit and loss can be preserved or additional entry can be made through split trading. It is a short-term investment perspective.)
---------------------------------

Tezos XTZ - Buy and Sell with Funnel Trend Pattern We broke down from top of funnel off weekly TD9 Sell, while slightly above daily sell zone area.
In the weekly Buy Zone now. If we break down from this zone then green daily and weekly green supports line are in play near bottom of funnel.
Red weekly extended sell zone is in play for an area to take profit after funnel break out.
Happy trading!

XTZ Potential Channel BounceI have been watching this channel on the logarithmic chart for Tezos for almost a year now, and at least thus far it has consistently bounced near the channel bottom which is currently approaching.
It looks further possible that a bounce might occur based on bullish reversal divergence on the daily chart for both MACD and RSI.
The bounce will likely be dependent upon BTC, but see my post yesterday for how I think that BTC might also bounce here, supporting the idea of a Tezos bounce:
Either way, should be interesting to see if the trend holds up or if a new trend is about to occur. And as always, this is solely my opinion and is not in any way meant as financial advice. But please like or comment if you agree or have any further opinions!

XTZ/USDT wyckoff phases (accumulation) Wyckoff Accumulation on Tezos/TetherUS
Tezos is in a accumulation pattern which for investors is a good opportunity .
I'm explaining my idea of investing so please make your own research before investing
Leave a like if my analysis it helps you !

XTZ Rebound Coming Soon!?doing a little update on XTZUSD on a 4H timeframe, since out last TA we were trading inside of the red pennant, we had a false breakout and a once again a drop that is keeping us in this sideways structure. Shown by the green horizontal lines we have been getting rejected and have bounced many times in this zone, going all the way back to the beginning of september we have been stuck in this sideways channel, the positive thing is that we are respecting it very well on the support side not slipping through the bottom, we are currently sitting near the bottom of the zone just having a bounce off of it and starting to move to the upside. Looking at our pivot points, price action just bounced off the S1 support level and our next target is definitely the blue pivot point, this level if broken above and held can trigger a reversal and pivot to the upside, we also have another pivot point we are looking at above the blue zone and capturing this level should definitely give XTZ that bullish boost we need to really start moving up. I also have a breakout zone drawn out that is going to be important to capture, it lines up with the secondary pivot point and is a decent ways above the green sideways channel we are currently stuck in, breaking above here and holding the box i have drawn out will give us big bullish momentum and is what we need to do to really get that upside boost, i should also point out that getting ahold of this area effectively breaks the current sideways structure and should lead to a breakout! Now looking at our wavetrend we are looking good here we had a bit of a double bottom in the buy zone and have since started to reverse to the upside, keep in mind this indicator is slow moving and doesn't usually make jagged or sharp moves, we usually see a smooth transition between bearish and bullish waves, i am expecting this to be the start of another bullish wave that could bring us well above that midline, we havent seen a really strong bullish wave since earlier this month and i am looking for something similar here coming soon!

XTZ CREATES PRESSURE It's tried to break it once, it failed. Now XTZ is coiling up big times under the resistance since oct'21.
In dec we might have seen the low and a 1-2, 1-2 formation since then.
Start a 3, break that resistance and fly
Hold my beer pls
----
No financial advice, do your own research, don't be stupid

XTZUSD D2: 200% gains BEST LEVEL TO BUY/HOLD(SL/TP)(UPDATE)Why get subbed to me on Tradingview?
-TOP author on TradingView
-2000+ ideas published
-15+ years experience in markets
-Professional chart break downs
-Supply/Demand Zones
-TD9 counts / combo review
-Key S/R levels
-No junk on my charts
-Frequent updates
-Covering FX/crypto/US stocks
-before/after analysis
-24/7 uptime so constant updates
🎁Please hit the like button and
🎁Leave a comment to support our team!
XTZUSD D2: 200% gains BEST LEVEL TO BUY/HOLD(SL/TP)(UPDATE)
IMPORTANT NOTE: speculative setup. do your own
due dill. use STOP LOSS. don't overleverage.
READ ENTIRE IDEA BEFORE EXECUTING.
🔸 Summary and potential trade setup
::: XTZUSD 2days/candle chart review
::: updated outlook still valid today
::: CORRECTION MODE next 1-4 weeks
::: correction just started not OVER
::: chart is LOG SCALE
::: get ready to BUY LOW later
::: BUY LOW later
::: entry - after 30% CORRECTION
::: up to 200% gains possible later
::: short-term pullback/correction
::: SPECULATIVE SETUP
::: do your own due dill
::: and use proper risk management
::: TP bulls is +200% gains
::: details: see chart
::: FINAL TP is 200% gains
::: recommended strategy: BUY/HOLD after pullback
::: TP BULLS +200% gains
::: SWING TRADE: BUY/HOLD IT
::: bull run not over yet
::: good luck traders!
::: BUY/HOLD and get paid. period.
🔸 Supply/Demand Zones
::: N/A
::: N/A
🔸 Other noteworthy technicals/fundies
::: TD9 /Combo update: N/A
::: Sentiment mid-term: BEARS/CORRECTION
::: Sentiment short-term: PULLBACK/CORRECTION NOW
RISK DISCLAIMER:
Trading Crypto, Futures , Forex, CFDs and Stocks involves a risk of loss.
Please consider carefully if such trading is appropriate for you.
Past performance is not indicative of future results.
Always limit your leverage and use tight stop loss.

Tezos ReminderQuick Update.
- Just a reminder about XTZ.
- Don't miss the next train
- invest wisely, don't go all in.
- TP : around 10$ (unchanged)
-** IMPORTANT ** to Check in my comments the older analysis to understand XTZ older Moves.
- Follow TheKing always!
Happy Tr4Ding !

Tezos to the future Interest growth by institutional investors
Decidedly long professional investors
In my opinion it is a good time to invest in xtzusd that in my opinion will be taken an explosion to 9 usd

BTC possible drop : Alt-seasonAlts are popping as BTC funds move out of btc into other coins. But I believe the next phase will play out just as it did in previous months. BTC still has not filled the previous low around 42,300$. Alts are moving up in anticipation of the next drop. I expect the moves to be something as follows:
-alts move up to MA (currently happening)
-Btc drops (probably hard and heavy)
-alts drop following btc drop (a good buy opportunity for alts imo)
My personal trade plan is to wait for btc to drop down towards previous low to create a Higher low. This would be my entry point. Not into BTC but into altcoins.
Happy holidays everyone.

XTZ (Tezos) Coin Analysis 15/03/2021Fundamentals:
Tezos is a blockchain network that’s based on smart contracts, in a way that’s not too dissimilar to Ethereum. However, there’s a big difference: Tezos aims to offer infrastructure that is more advanced — meaning it can evolve and improve over time without there ever being a danger of a hard fork. This is something that both Bitcoin and Ethereum have suffered since they were created. People who hold XTZ can vote on proposals for protocol upgrades that have been put forward by Tezos developers.
This open-source platform bills itself as “secure, upgradable and built to last” — and says its smart contract language provides the accuracy that is required for high-value use cases. According to Tezos, its approach means that it is futureproof and will “remain state-of-the-art long into the future,” meaning it can embrace developments in blockchain technology.
The technology underpinning Tezos was first proposed in a white paper that was released in September 2014. After a series of delays, the Tezos mainnet launched four years later.
Although staking is common across blockchains, Tezos has a unique twist on this process. Participants can get involved with the network’s governance through “baking,” where they effectively stake 8,000 XTZ. This creates a financial incentive to act honestly.
Bakers are then tasked with voting on proposed changes to the blockchain’s code in a four-step procedure that takes approximately 23 days. Proposals that receive support from the vast majority of participants are put through their paces on a testnet for 48 hours and are fully implemented if they are backed by a super-majority.
Tezos is also unique because of how it has started to be used by high-profile businesses. In September 2020, it was announced that the French banking giant Societe Generale planned to use this blockchain for experimenting with a central bank digital currency.
Big cryptocurrency exchanges such as Binance and Coinbase have also unveiled support for Tezos staking, meaning users can receive rewards based on the XTZ that they hold. This is not a feature that’s seen too widely across digital assets.
Arthur Breitman was the man who wrote the Tezos white paper — and in a nod to Satoshi Nakamoto, he wrote his works under the pen name L. M. Goodman. He argued that one of Bitcoin’s biggest failings was the lack of a governance process that invited contributions from the community who use the network — as well as the fact that new tokens couldn’t be issued through this blockchain.
He and his wife Kathleen founded a startup called Dynamic Ledger Solutions which was tasked with writing the code that would underpin the Tezos protocol. This company was subsequently purchased by the Tezos Foundation to ensure that it owned all of the intellectual property rights relating to the network.
Technical Analysis:
there exist a Hidden Bullish Divergence with MACD Histogram which is the sign of trend Continuation,
there are total of 3 Targets Specified By Fibonacci Projection, where as the 3TP gets its confirmation as the price Triggers the 2 TP followed by Price Correction.

Going Short for a WhilePrice is under 2 resistance levels and we need to be aware.
Market is attempting a rebound today, whereas stock markets are taking a small beating and VIX (volatility index) is rising.
Let's see what happens next.
One ove,
the FXPROFESSOR

XTZ can Be Bullish Here is Why.Hi every one
TEZOS / TETHERUS
XTZ is In a Big Broadening Wedge Pattern. This Means The Price Can Range Between This Pattern Freely Until a Break out Happens.Now The Price is at The Bottom of This Patter So There is a High Chance For Bullish Movement To Happen Soon. The Resistance Is Shown on The Chart.
This is only an idea and not a financial advise ( NFA )🔴
💎Traders, if you liked this idea or have your opinion on it, write in the comments, We will be glad.
Thank you for seeing idea .
Have a nice day and Good luck

Tezos Healthy RiseXTZ is making higher highs and corrections seem healthy and following Fibo Retracements.
i don't know much about Tezos FA so i will stay quiet on it.
Like always keep an eye on BTC moves, Everything in Graph !
Good buy zones :
- 3.5$
- 3 $
Sell Zones :
TP1 : 7$
TP2 : 9.9$
Happy Tr4Ding !

XTZ, buy or go long, short-term gains of more than 50%XTZ appears to be in an objective rebound.
The operation recommendations are as follows,
Entry price:
Current price 30%
4.6-4.9 70%
target price:
5.6, 7.3, 8; drop the bag in batches in turn.
Stop loss price:
4.5 50%
4.2 50%
good luck!
