Welcome to XTZ/USDT trade setup update Welcome to XTZ/USDT 1DAY quick analysis
I have tried my best to bring the best possible outcome in this chart.
xtz/usdt currently broke the upper trend line and retesting, here we can take a position for 200% potential rally.
Entry:-CMP $2.91,$3.17
Target:-200%
Stoploss:-$2.52
With leverage 2x to 5x
And long term hold and good profit 😉🙂😊✈️✈️
Q:-What do you think about this?
Do you think we will see a new ATH of XTZ in the next quarter?
Share your views in the comment section.
Remember:-This is not a piece of financial advice. All investment made by me is under my own risk and I am held responsible for my own profit and losses. So, do your own research before investing in this trade.
Happy trading.
Sorry for my English it is not my native language.
Do hit the like button if you like it and share your charts in the comments section.
Thank you.
XTZUSDT

#Xtz / #Usdt#Futures / #Scalp
❇️Buy zone 1 : 3.044
lev 5~10x
🎯Targets : 3.09 / 3.119 / 3.155 / 3.19 / 3.22
⛔️Stop loss : 2.951
🛑Don't risk more than 3% of capital.

XTZUSDT: RETESTING SUPPLY ZONE, ALTCOINS CONTINUE MOVING LOWER?Hello CryptoTrading Enthusiast! Help the Channel Growth by smashing the FOLLOW and LIKES Button, then Share your opinion on the Comment Section below :)
XTZUSDT created falling wedge pattern. Macd Indicator start crossing down toward the zero level area, it signify the potential bearish movement ahead on XTZUSDT.
*Now We put all the explaination on the chart* Enjoy!
*DISCLAIMER:
This isn't a recommendation to buy or sell cryptocurrency, only an Outlook from technical perspective.
*FOLLOW FOR MORE CONTENTS AND UPDATES*

Buy Tezos/ XTZUSDTLooking at the market, Tezos looks nice to buy at this current moment on the 15 minute chart based on market trends.

XTZUSD D1: 350% gains BEST LEVEL TO BUY/HOLD(SL/TP)(SWING)Why get subbed to me on Tradingview?
-TOP author on TradingView
-2000+ ideas published
-15+ years experience in markets
-Professional chart break downs
-Supply/Demand Zones
-TD9 counts / combo review
-Key S/R levels
-No junk on my charts
-Frequent updates
-Covering FX/crypto/US stocks
-before/after analysis
-24/7 uptime so constant updates
🎁Please hit the like button and
🎁Leave a comment to support our team!
XTZUSD D1: 350% gains BEST LEVEL TO BUY/HOLD(SL/TP)(SWING)
IMPORTANT NOTE: speculative setup. do your own
due dill. use STOP LOSS. don't overleverage.
READ ENTIRE IDEA BEFORE EXECUTING.
🔸 Summary and potential trade setup
::: XTZUSD 1days/candle chart review
::: updated outlook still valid today
::: CORRECTION MODE next 1-4 weeks
::: correction just started not OVER
::: chart is LOG SCALE
::: get ready to BUY LOW later
::: BUY LOW later
::: entry - after 30% CORRECTION
::: up to 350% gains possible later
::: short-term pullback/correction
::: SPECULATIVE SETUP
::: do your own due dill
::: and use proper risk management
::: TP bulls is +350% gains
::: details: see chart
::: FINAL TP is 350% gains
::: recommended strategy: BUY/HOLD after pullback
::: TP BULLS +350% gains
::: SWING TRADE: BUY/HOLD IT
::: bull run not over yet
::: good luck traders!
::: BUY/HOLD and get paid. period.
🔸 Supply/Demand Zones
::: N/A
::: N/A
🔸 Other noteworthy technicals/fundies
::: TD9 /Combo update: N/A
::: Sentiment mid-term: BULLS/REVERSAL/350% GAINS
::: Sentiment short-term: PULLBACK/CORRECTION NOW
RISK DISCLAIMER:
Trading Crypto, Futures , Forex, CFDs and Stocks involves a risk of loss.
Please consider carefully if such trading is appropriate for you.
Past performance is not indicative of future results.
Always limit your leverage and use tight stop loss.

Tezos (XTZUSDT) TA: 22.2.27Tezos is located at the bottom of the canal for a long time, which is well supported every time it hits the bottom of the canal. If it leaves the red channel, it can continue its long-term upward trend. But if it leaves the blue channel, it can see 1.85 support.
⚠️ This Analysis will be updated ...
👤 Sadegh Ahmadi: @SDQ_Crypto
📅 27.Feb.22
⚠️(DYOR)
❤️ If you apperciate my work , Please like and comment , It Keeps me motivated to do better

TEZOS TA : 02.26.22 : $XTZ : +35% ✅As you can see the price after reaching and returning to The Bullish Order Blocks reacted positively and increase more than 35% . the Next targets are $ 3.9 , $ 4.32 and $ 5.36 .
All the supports and resistances are marked on the chart and everything is clear in this analysis , but , just in case , if you had any questions or doubts Please feel free to ask in the Comment section .
Follow us for more analysis & Feel free to ask any questions you have, we are here to help.
⚠️ This Analysis will be updated ...
👤 Arman Shaban : @ArmanShabanTrading
📅 26.Feb.22
⚠️(DYOR)
❤️ If you apperciate my work , Please like and comment , It Keeps me motivated to do better ❤️

SOLUSDT QM PATTERN, 19.02.22, chart obviously shows QM pattern (magnified HIGH & LOW), a downtrend pat.
at first it should break the red support line and next the first TP on 81$ is available.
please, do not hesitate to contact us and support with your ideas and comments. thanks alot
19.02.22
DYOR

Update For XTX/USDT Analysis 📈📉What's up Guys , in this analysis I gonna talk about TEZOS!
As we see on the WEEKLY timeframe for XTZ/USDT ,since it has reached highest price $9.171 ,
it hasn't successful to rise again and record a new ATH ,now by retracement of last bullish wave ,it recently reached
to 0.236 fibo level , after its recent downfall tried to close above pivot zone but the selling
pressure pulled it back below this range which is now a resistance zone , but its still above
its strong support zone and can have a growth to higher resistance levels and even top ascending trend line .
but otherwise in view point of price action, if it not be able to maintain current support level and trendline ,
it maybe drop again to lower support area . in another case maybe being in side way for while ,
and fluctuate between higher and lower volume ranges zone .
🛑resistance level: $6.42 -$6.7/// 5.2$-5.55$///trenline
🆚pivot zone: $4.2-4.4$
❇️support levels: $2.8-3.2$///$2-$2.18///$1.456///trenline
--------------------------------------------------------------------------------------------------------------------
👉This analysis is my personal opinion ,not a financial advice ,so do your own research.
💜 if you're a fan of my analyses PLZ follow me and give a big thumbs 👍 OR drop comment 🗯💭

XTZ - Detailed Video Analysis!Hello everyone, if you like the idea, do not forget to support with a like and follow.
Here is the top-down analysis for XTZ , feel free to request any pair/instrument or ask any questions in the comment section below.
Best of luck!

XTZUSDT , 4H , 19.02.22As you see, XTZ build HEAD & SHOULDER pattern and break the neckline. right now complete the pullback, next will see it at nearest support 3.23$
if support dont act the next one is 2.73$.
19.02.22
DYOR

LTCUSDT, 1W, 19.02.22always I take a look at time weekly to have pig picture about what analysis.
please, keep this feature in your mind. around 93$ two long support line cross each other and make strong PRZ which expect to swing descending pattern.
we will follow the patterns at time frame 4h.
I hope this analysis would be helpful.
19.02.22
DYOR

XTZUSDT Analysis (LOCAL VISION)Hello friends.
Please support my work by clicking the LIKE button👍(If you liked). Also i will appreciate for ur activity. Thank you!
Everything on the chart.
Since we have received a beautiful upward impulse and are now in a correction to it, there is no doubt that we will update the local top.
2 options on the chart, I tend more towards the yellow option, but if bitcoin shows a complication with the 40k test, then xtz will also adjust to the ~3.5$ and only then will show growth.
Entry: market and lower
Target: 4.5 - 4.9 - 5.3
Stop: (depending of ur risk). ALWAYS follow ur RM .
risk is justified
Good luck everyone!
Follow me on TRADINGView, if you don't want to miss my next analysis or signals.
It's not financial advice.
Dont Forget, always make your own research before to trade my ideas!
Open to any questions and suggestions.

XTZUSD H4: 80% gains XABCD BEST LEVEL TO BUY(SL/TP)(NEW)Why get subbed to me on Tradingview?
-TOP author on TradingView
-2000+ ideas published
-15+ years experience in markets
-Professional chart break downs
-Supply/Demand Zones
-TD9 counts / combo review
-Key S/R levels
-No junk on my charts
-Frequent updates
-Covering FX/crypto/US stocks
-before/after analysis
-24/7 uptime so constant updates
🎁Please hit the like button and
🎁Leave a comment to support our team!
XTZUSD H4: 80% gains XABCD BEST LEVEL TO BUY(SL/TP)(NEW)
IMPORTANT NOTE: speculative setup. do your own
due dill. use STOP LOSS. don't overleverage.
IMPORTANT NOTE: always do your own due dill.
not financial advice.
🔸 Summary and potential trade setup
::: XTZUSD 4hour/candle chart review
::: updated/revised outlook
::: still great setup for 80% gains
::: we already got valid reversal
::: at point C / so it's cycle low now
::: speculative XABCD setup in progress
::: BULLS BUY DIPS / market BUY NOW
::: from my level TP +80% gains
::: this is BUY/HOLD setup
::: patient traders only
::: not for gamblers
::: SPECULATIVE SETUP
::: do your own due dill
::: and use proper risk management
::: TP bulls is +80% gains USD
::: details: see chart
::: FINAL TP +80% gains point D
::: recommended strategy: BUY/HOLD
::: SWING TRADE: BUY/HOLD IT
::: bull run not over yet
::: good luck traders!
::: BUY/HOLD and get paid. period.
🔸 Supply/Demand Zones
::: N/A
::: N/A
🔸 Other noteworthy technicals/fundies
::: TD9 /Combo update: N/A
::: Sentiment mid-term: BULLS/PUMP/point D
::: Sentiment short-term: BEARS/PULLBACK/point C
RISK DISCLAIMER:
Trading Crypto, Futures , Forex, CFDs and Stocks involves a risk of loss.
Please consider carefully if such trading is appropriate for you.
Past performance is not indicative of future results.
Always limit your leverage and use tight stop loss.

XTZUSDT , 1W , 15.02.22Hi guys
Just take a look in long term for XTZ.
we have an important resistance around 4.3, to see middle of channel (around 5.6) should stay above 4.6.
EMA200 at Daily time frame place on 4.6 which make the price more important.
we will follow patterns in lower time frame as soon.
15.02.22
DYOR

XTZ a low risk midterm investmentHi guys,
XTZ has a key position at current prices, It's experiencing an expanding harmonic pattern and in the midterm, can have a decent profit.
Follow and comment

XTZ/USDT Current update after break down#XTZ/USDT
$XTZ dumped -7% after break down.
What now..?
Still not In trade zone.
I am buying only if Breaks White line Resistance.
White Line Resistance = $4.20
If break the Resistance then we can aee $6 in coming days.
But wait for Confirmations.
Support:- $3.80
Resistance:- $4.20
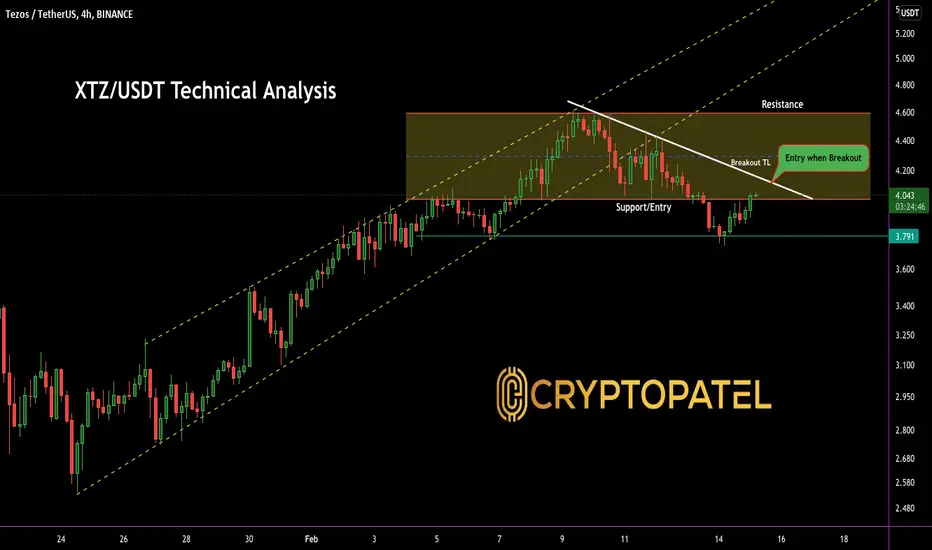
XTZ/USDT Technical Overview#XTZ/USDT Technical Overview:-
$XTZ trading at $4.04
This is Good support.
If $XTZ prize hit $4.40 thats would be good price to Enter because of Confirmations.
I am buying some here around $4.00
If Price go below $3.90 then I will exit.
Targets:- $4.40
If Hit $4.50 then New Target would be $6
Need to break White TL.
Support:- $4
Resistance:- $4.60/$5.60

Sending XTZ to the moon Ascending triangle and ascending channel spotted in XTZ 4H chart. Considering the weekly moving average support and price movements, it's pulling back to both "horizontal S/R of ascending channel" and "ascending channel midline" which both will operate as strong supports. So fasten your seatbelts after the pullback is done.
Trade Safe ...

XTZ Midterm Movement Analysis 📊 XTZUSDT (TEZOS)
💹 Time Frame: Daily (Update)
➖➖➖➖➖➖➖➖
🟡 XTZ broke the downward trend line and is trying to hold above it. we have 2 scenarios for Tezos!!
✅ The current trend may retest dynamic support and bounce to S/R level and start another bullish Cycle to 0.618 Fibonacci level.
✅ The current trend directly heading forward to retest S/R key level and reject and break the dynamic support the pullback and start another bearish Cycle.
➖➖➖➖➖➖➖➖
👤 AmirHossein
📅 02.09.2022
⚠️ (DYOR)
BINANCE:XTZUSDT

Correction complete time to long TEZOS XTZUSDTThis setup like any ALT/Derivative or Spot setup is and always will be dependable on how BTC is trading .
Please ensure you understand this as I have been trolled by individuals whom dont understand the distinction and thus probably lose money and take it out on me .
Ok well here we have the XTZ/USDT Pair on Bybit Perpetual contract .
As you can see from the drawing we have completed a full retracement down to the .886 fib and made a nice reaction off of this level ,
with a back test of the .382 back on the 5th Of Feb and now we are slowly building on some upwards movement again .
If you are looking to enter I would suggest that you set some alerts and maybe we pull back to the .382 when BTC throws a wobbly or the .236 if we were to
fast wick down ... again revolving around BTC !
Sitting at the .786 level is the POC so i would not expect to go straight through it as i anticipate a fair level of resistance here .
My targets would be around the 1-1 as marked and around the VAH .
Ensure to take profits on the way up in increments of 25% for example .
.Always use a SL and know your Invalidation

Tezos Breakout✔ #XTZ $XTZTezos, which has been on a low-slope ascending channel for 836 days, is now moving from the bottom of the channel to the top of the channel, breaking a 126-day downtrend line and after stabilizing the price, it is ready to move to the midline and The roof of the canal. There is also a positive divergence in the chart, which could be a sign that the trend is moving up.
I hope you find this analysis useful🌹
Follow for more...
#DYOR

TRX 3 scenario#TRX/USDT
$TRX rejected from support zone, and reached a resistance zone.
🐮 if price hold the support zone, and break out from resistance zone around $0.077, so it is going up to touch upper line of triangle around resistance zone of $0.09.
🐮🐮 break out from triangle will help price increase more to complete double bottom pattern at $0.15 and $0.176.
🐻 break down from lower line of triangle and support zone, will drop price to complete AB=CD pattern around $0.03
