TRX 3 scenario#TRX/USDT
$TRX rejected from support zone, and reached a resistance zone.
🐮 if price hold the support zone, and break out from resistance zone around $0.077, so it is going up to touch upper line of triangle around resistance zone of $0.09.
🐮🐮 break out from triangle will help price increase more to complete double bottom pattern at $0.15 and $0.176.
🐻 break down from lower line of triangle and support zone, will drop price to complete AB=CD pattern around $0.03
XTZUSDT

XTZ/USDT is more like dogeHELLO FRIENDS, XTZ/USDT is forming Descending Channel Formation in Daily timeframe Chart. So far Bulls in Complete Control & Seems like Ready for Massive Upside Breakout..🏄♂️. FOLLOW FOR MORE

XTZUSDT-SHORTBased on technical factors there is a short position in :
XTZUSDT Tezos
Score 2️⃣
🔴Short Now or set on Key Level 4.015
🟢Target 1 3.690
🟢Target 2 3.390
🟢Target 3 2.750
❌Stop loss 4.115
#K_Level
Every signal has a score from 1 to 5, so accordingly adjust your risk for each signal. The signals with the score of 5 are the most probable ones.
Please support our activity with your likes and comments.

💥TEZOS IS READY FOR 2X ROI TO $8🚀Please support this idea with a LIKE👍 if you find it useful🥳
Not a financial advice🙅🏼♂️
Price bounced back from the fourth support zone on the trendline and it’s currently heading to the upper trendline serving as resistance.
This right here is a confirmation that price is rising to $8.
What do you think?
Share your opinion in the comment section✍️
Follow me to receive more updates on TEZOS (XTZUSD ) 🤗
Happy Trading💰🥳🤗

TEZOS | Descending Channel Pattern..!!
#XTZ (Update)
Descending Channel Consolidation Continues..📉
So far Looks Bullish & In Case of Upside Breakout, expecting +100-120% Bullish Wave..
📍 Always Wait for Confirmed Breakout & Candle to Close and Only then ENTER..
Please like the idea for Support & Subscribe for More ideas like this and share your ideas and charts in Comments Section..!!
Thanks for Your Love & Support..!!

Xtz big opportunityEasy, everytime bigger.
Opened long position.
Weekly chart.
Buy at 3.44$ sell at 11$
In 4 weeks from now.
400% up
Everytime was bigger than the previous one.

XTZ short setupTezos had a nice run over the past week but is still in a general downtrend and currently reaching a tough resistance area, which coincides with:
- 0.5 FIB level
- 50 EMA
- Low volume compared to the last big run in sep/21. This makes me confident in that we are more likely to see a move down.
Waiting for confirmation on the lower timeframes before entering

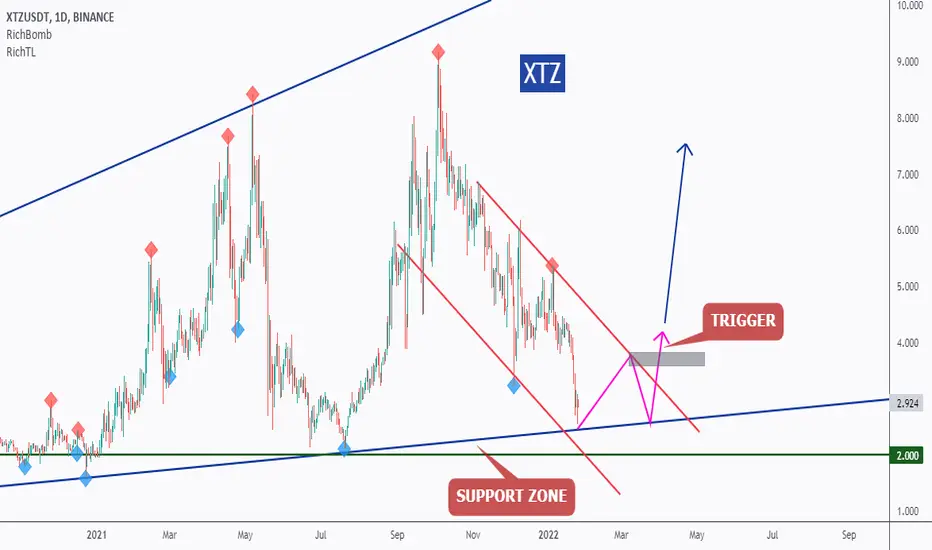
XTZ - Long-Term Bullish Reversal!Hello everyone, if you like the idea, do not forget to support with a like and follow.
XTZ is approaching a strong support so we will be looking for buy setups.
on DAILY: XTZ is forming a channel but the upper trendline is not valid yet, so we are waiting for a new swing high to form around it to consider it our trigger swing. (projection in purple)
Trigger => Waiting for that swing to form and then buy after a momentum candle close above it (gray zone)
Meanwhile, until the buy is activated, XTZ would be overall bearish can still trade lower inside the green.
Good luck!
All Strategies Are Good; If Managed Properly!
~Rich
High Risk XTZUSDT Long ScalpHigh Risk XTZUSDT Long Scalp. Targets on the chart. 10x leverage, sl is liquidation. This is a pullback entry. Limit order pull back in green.

XTZUSDTHello Crypto Lovers,
Mars Signals team wishes you high profits.
We are in the weekly time frame. There is the S1 line which has supported the price in the long term. It is at a very good spot to buy while keeping the Stop Loss. There is the R1 line which is a very strong resistance and the price has made long shadows to this line in the current months. If the S1 holds, then you can save your profit at the R1 line and if R1 is broken, then the price will increase more. If S1 is broken, then there would be more falling which is less likely.
Warning: This is just a suggestion and we do not guarantee profits. We advise you to analyze the chart before opening any positions.
Wish you luck

Tezos (XTZ) - January 25Hello?
Traders, welcome.
If you "follow", you can always get new information quickly.
Please also click "Like".
Have a nice day.
-------------------------------------
(XTZUSD 1W Chart)
(Full: )
1.8553 2069 point and above: uptrend expected to continue
4.0914 4691-4.4192 4300 or more: Expected to create a new wave.
You need to see if the uptrend can continue along the uptrend line.
A move above the 4.4192 4300 point is expected to accelerate the uptrend and find resistance at the 5.5738 1603-6.0233 4096 section.
If it goes down from the uptrend line, it is likely to drop below the 1.8553 2069 point, so trade cautiously.
-------------------------------------
(XTZBTC 1W Chart)
0.0001 4931-0.0001 7620 or higher: Expected to create a new wave.
Beginning in September 2021, the Bollinger Bands began to contract.
Therefore, a break from the downtrend line above the 0.0000 9730 point is expected to turn into an uptrend.
0.0000 6690-0.0001 4931 section is the bottom section.
------------------------------------------
We recommend that you trade with your average unit price.
This is because, if the price is below your average unit price, whether the price trend is in an upward trend or a downward trend, there is a high possibility that you will not be able to get a big profit due to the psychological burden.
The center of all trading starts with the average unit price at which you start trading.
If you ignore this, you may be trading in the wrong direction.
Therefore, it is important to find a way to lower the average unit price and adjust the proportion of the investment, ultimately allowing the funds corresponding to the profits to be able to regenerate themselves.
------------------------------------------------------------ -----------------------------------------------------
** All indicators are lagging indicators.
Therefore, it is important to be aware that the indicator will move accordingly as price and volume move.
However, for convenience, we are talking in reverse for the interpretation of the indicator.
** The MRHAB-O and MRHAB-B indicators used in the chart are indicators of our channel that have not been released yet.
(Since it was not disclosed, you can use this chart without any restrictions by sharing this chart and copying and pasting the indicators.)
** The wRSI_SR indicator is an indicator created by adding settings and options to the existing Stochastic RSI indicator.
Therefore, the interpretation is the same as the traditional Stochastic RSI indicator. (K, D line -> R, S line)
** The OBV indicator was re-created by applying a formula to the DepthHouse Trading indicator, an indicator disclosed by oh92. (Thanks for this.)
** Support or resistance is based on the closing price of the 1D chart.
** All descriptions are for reference only and do not guarantee a profit or loss in investment.
(Short-term Stop Loss can be said to be a point where profit and loss can be preserved or additional entry can be made through split trading. It is a short-term investment perspective.)
---------------------------------

XTZUSDT: RISING WEDGE, SIGN OF PREVAILING BEARISH TREND?Hello Enthusiast Coin Addict! Here's short-term outlook for XTZUSDT , Support the Channel by smashing the FOLLOW and LIKES Button, then Share your opinion on the Comment Section below :)
*XTZUSDT is breaking out of the Rising Wedge Pattern
*Breakout of Rising Wedge Pattern could indicate a potential bearish movement in the near future
*MACD indicator already crossed below the zero level area, that signify the potential stronger bearish momentum may remains ahead.
The roadmap will be invalid after exceeding the resistance/target level
*DISCLAIMER:
This isn't a recommendation to buy or sell cryptocurrency, only an Outlook from technical perspective.

Tezos XTZ - Buy and Sell with Funnel Trend Pattern We broke down from top of funnel off weekly TD9 Sell, while slightly above daily sell zone area.
In the weekly Buy Zone now. If we break down from this zone then green daily and weekly green supports line are in play near bottom of funnel.
Red weekly extended sell zone is in play for an area to take profit after funnel break out.
Happy trading!

XTZUSDT Analysis (LOCAL VISION)Hello friends.
Please support my work by clicking the LIKE button👍(If you liked).Thank you!
Everything on the chart.
Nothing has changed from my last idea.
Entry: market and lower
Target: 6.4 and 7.4
after first target reached move ur stop to breakeven
Stop: ~3.7(depending of ur risk). ALWAYS follow ur RM .
Risk/Reward: 1 to 3
risk is justified
Good luck everyone!
Follow me on TRADINGView, if you don't want to miss my next analysis or signals.
It's not financial advice.
Dont Forget, always make your own research before to trade my ideas!
Open to any questions and suggestions.

XTZ Rebound Coming Soon!?doing a little update on XTZUSD on a 4H timeframe, since out last TA we were trading inside of the red pennant, we had a false breakout and a once again a drop that is keeping us in this sideways structure. Shown by the green horizontal lines we have been getting rejected and have bounced many times in this zone, going all the way back to the beginning of september we have been stuck in this sideways channel, the positive thing is that we are respecting it very well on the support side not slipping through the bottom, we are currently sitting near the bottom of the zone just having a bounce off of it and starting to move to the upside. Looking at our pivot points, price action just bounced off the S1 support level and our next target is definitely the blue pivot point, this level if broken above and held can trigger a reversal and pivot to the upside, we also have another pivot point we are looking at above the blue zone and capturing this level should definitely give XTZ that bullish boost we need to really start moving up. I also have a breakout zone drawn out that is going to be important to capture, it lines up with the secondary pivot point and is a decent ways above the green sideways channel we are currently stuck in, breaking above here and holding the box i have drawn out will give us big bullish momentum and is what we need to do to really get that upside boost, i should also point out that getting ahold of this area effectively breaks the current sideways structure and should lead to a breakout! Now looking at our wavetrend we are looking good here we had a bit of a double bottom in the buy zone and have since started to reverse to the upside, keep in mind this indicator is slow moving and doesn't usually make jagged or sharp moves, we usually see a smooth transition between bearish and bullish waves, i am expecting this to be the start of another bullish wave that could bring us well above that midline, we havent seen a really strong bullish wave since earlier this month and i am looking for something similar here coming soon!

XTZUSD D2: 200% gains BEST LEVEL TO BUY/HOLD(SL/TP)(UPDATE)Why get subbed to me on Tradingview?
-TOP author on TradingView
-2000+ ideas published
-15+ years experience in markets
-Professional chart break downs
-Supply/Demand Zones
-TD9 counts / combo review
-Key S/R levels
-No junk on my charts
-Frequent updates
-Covering FX/crypto/US stocks
-before/after analysis
-24/7 uptime so constant updates
🎁Please hit the like button and
🎁Leave a comment to support our team!
XTZUSD D2: 200% gains BEST LEVEL TO BUY/HOLD(SL/TP)(UPDATE)
IMPORTANT NOTE: speculative setup. do your own
due dill. use STOP LOSS. don't overleverage.
READ ENTIRE IDEA BEFORE EXECUTING.
🔸 Summary and potential trade setup
::: XTZUSD 2days/candle chart review
::: updated outlook still valid today
::: CORRECTION MODE next 1-4 weeks
::: correction just started not OVER
::: chart is LOG SCALE
::: get ready to BUY LOW later
::: BUY LOW later
::: entry - after 30% CORRECTION
::: up to 200% gains possible later
::: short-term pullback/correction
::: SPECULATIVE SETUP
::: do your own due dill
::: and use proper risk management
::: TP bulls is +200% gains
::: details: see chart
::: FINAL TP is 200% gains
::: recommended strategy: BUY/HOLD after pullback
::: TP BULLS +200% gains
::: SWING TRADE: BUY/HOLD IT
::: bull run not over yet
::: good luck traders!
::: BUY/HOLD and get paid. period.
🔸 Supply/Demand Zones
::: N/A
::: N/A
🔸 Other noteworthy technicals/fundies
::: TD9 /Combo update: N/A
::: Sentiment mid-term: BEARS/CORRECTION
::: Sentiment short-term: PULLBACK/CORRECTION NOW
RISK DISCLAIMER:
Trading Crypto, Futures , Forex, CFDs and Stocks involves a risk of loss.
Please consider carefully if such trading is appropriate for you.
Past performance is not indicative of future results.
Always limit your leverage and use tight stop loss.

Tezos ReminderQuick Update.
- Just a reminder about XTZ.
- Don't miss the next train
- invest wisely, don't go all in.
- TP : around 10$ (unchanged)
-** IMPORTANT ** to Check in my comments the older analysis to understand XTZ older Moves.
- Follow TheKing always!
Happy Tr4Ding !

XTZUSDT AnalysisHello friends.
Please support my work by clicking the LIKE button(If you liked).Thank you!
Everything on the chart.
open pos: market and lower
target: 6.4 and 7.4
after first target reached move ur stop to breakeven
stop: under 4(depending of ur risk). ALWAYS follow ur RM .
riwk/reward: 1 to 3
risk is justified
Good luck everyone!
Follow me on TRADINGView, if you don't want to miss my next analysis or signals.
It's not financial advice.
Dont Forget, always make your own research before to trade my ideas!

XTZ can Be Bullish Here is Why.Hi every one
TEZOS / TETHERUS
XTZ is In a Big Broadening Wedge Pattern. This Means The Price Can Range Between This Pattern Freely Until a Break out Happens.Now The Price is at The Bottom of This Patter So There is a High Chance For Bullish Movement To Happen Soon. The Resistance Is Shown on The Chart.
This is only an idea and not a financial advise ( NFA )🔴
💎Traders, if you liked this idea or have your opinion on it, write in the comments, We will be glad.
Thank you for seeing idea .
Have a nice day and Good luck


TEZOS Daily TA : 01.04.22 : $XTZ🟡 Results so far (HH) : +13% 🔥In less than a day ...
All supports and resistances are marked on the chart. As we can see, the price is in an important range and recommended to keep an eye on it ...
Follow our other analysis & Feel free to ask any questions you have, we are here to help.
⚠️ This Analysis will be updated ...
👤 Arman Shaban : @ArmanShabanTrading
📅 04.Jan.22
⚠️(DYOR)
❤️ If you apperciate my work , Please like and comment , It Keeps me motivated to do better ❤️


Tezos Healthy RiseXTZ is making higher highs and corrections seem healthy and following Fibo Retracements.
i don't know much about Tezos FA so i will stay quiet on it.
Like always keep an eye on BTC moves, Everything in Graph !
Good buy zones :
- 3.5$
- 3 $
Sell Zones :
TP1 : 7$
TP2 : 9.9$
Happy Tr4Ding !
