Über bullish on XTZHello people! I made a rough call in my last post and perhaps was a bit too bullish. I managed to leave however with a good bit a profit in XTZ from my long and needed to take a bit of a break to regain my bearings.
And as of recent... HOLY... Reno news, Kolibri, Greyscale, Dexter, Opensea, Arthur on the council.
This is probably the most bullish set up of fundamentals and technicals I have ever seen. XTZBTC formed a Cypher pattern which will lead to a momentous explosion on the pair. XTZUSD is on the bottom part of the support channel with a downward resistance line being tested as I write this. The RSI and Stoch are ready to be sent into the stratosphere on the daily.
I used kolibri to take out a margin position with a liquidation real low. I'm ready to ride tezos to 1000. I hope you are with me. Godspeed and Godbless.
Not financial advice.
XTZUSDT

XTZ/BTC Ready for 1000% from here..?XTZ/BTC Bullish Technical Analysis By CryptoPatel:-
#XTZ/BTC Chart loiking very good at this time.
So In can Expect big from here.
Currently Trading at 0.00007740 BTC.
This is very good accumulation zone and Support is Very good at this Level.
As per TA currently trading at support leve. adn this level is very strong support level.
And I also can expect new All Time high in comming Days.
Support : 0.0000670 BTC
Resistance: 0.0000934 / 0.0001495 / 0.0002463 / 0.0003726 BTC
This is Chart Drawn by My own way. This is CryptoPatel Parabolic Pattern.
Don't Miss to any Technical Analysis update.
Don't Forget to share your Love.
Targets:
TP1: 0.0000934 BTC
TP2: 0.0001495 BTC
TP3: 0.0002463 BTC
TP4: 0.0003726 BTC
Please Click LIKE button and Appreciate my hard work.
Must follow me for latest crypto real time updates.
Thank you.

Tezos (XTZ) Build Your Position before next pumpTezos is one the most active team and the team is continually working on the project and developments. Grayscale also registered a trust to offer Tezos (XTZ) to its investors. We will see a good rally in XTZ in 2021. Build your position before the next rally.
Buy Zone: $3.2 - $3.5 (add more if drops to $2.8)
Target: $4 - $4.5 - $5 - $5.5 - $6 -$6.7 - $7.5 - $8.5 - $9.8 (Go beyond these in long term)

Tezos (XTZ)/USDT Market Cycles Pivot points (zones) PsychologyI have combined the idea of learning by cycles and pivot points (zones) with an actual trading idea for positional work using the example of the Tezos (XTZ) coin paired with USDT (USD).
According to Dow theory, there are 3 types of trends:
1) main (long-term).
2) minor.
3) insignificant (small).
3) Phases of trends.
In turn, each trend has the following phases:
1) phase of accumulation (set of position).
2) the phase of public participation (trend development)
3) panic phase (reset position).
4) the phase of price reduction (dump).
1. The phase of accumulation. (position set).
This stage occurs after the market has finished the downtrend and the dump is stopped. The price has formed a "bottom", in slang they say "bottom". It is at this stage that traders and investors enter the market, which can rightfully be called professional. They have the greatest amount of information (often internal - insiders) about the current state of the market and are the first to start active actions. The rest of the market participants do not realize at this time the state and direction of the market.
Of course, the accumulation phase is not easy to detect. It often follows a downtrend. And it can be, in turn, just a minor trend in the general downtrend. As a result, instead of a new trend, only a temporary pullback is obtained. From a technical point of view, the beginning of a new trend is always accompanied by a period of consolidation. This is when the market goes sideways and then starts to show an uptrend.
2. Phase of public participation (trend development).
Participation Phase Advanced investors and traders enter the market in the accumulation phase. When the trend really reverses, the public participation phase begins. Here the crowd enters the market. As this stage progresses, more traders jump into the current move as fear of loss is suppressed by greed and fear of missing out on an opportunity. This phase is the longest of all and is also characterized by the most active movement. Highs are constantly being updated - exactly what investors have been waiting for. The trend is developing. When this stage begins to end, the "last majority" jumps into the market and trading volumes begin to increase significantly. At this point, the theory of great stupidity prevails. The price rises significantly beyond historical levels, and logic and reason give way to greed.
While the majority enter the market, professional traders cut or close their trading positions. But as prices begin to level off or the rally slows down, those latecomers who stay out of the game see it as a buying opportunity and enter the market. Prices make the last parabolic move, known in technical analysis as a buying climax, when the greatest profits are often made in a short period.
3. Panic phase (reset position, distribution)
This is the phase where experienced traders and investors exit the market, and less experienced ones, on the contrary, enter the market. As a result, these investors and traders are excited about buying at the peak of the trend, shortly before its spectacular fall. The same phase is also a reversal one - professional investors and traders understand that the market has exhausted itself and begin to close their positions opened in the first phase.
To identify this phase, it is necessary to carefully study the signs that the market rally is complete. Moreover, the more active the market growth, the stronger the subsequent fall will be.
In the third stage of the market cycle, sellers begin to dominate. This part of the cycle is identified by a period in which the bullish sentiment of the previous stage is replaced by mixed sentiment. When this stage is over, the market direction changes. Classic chart patterns such as "double and triple top" or "head and shoulder" are examples of such movements that occur during the distribution stage.
The distribution stage is a very emotional period for the markets as investors are gripped by periods of complete fear, interspersed with hope and even greed, as at times the market may seem to be rising again.
Panic phase in a downtrend.
A similar story is when the main trend is bearish and goes down. The situation repeats itself in a mirror image, and at the implementation stage, a real panic is often formed, when many inexperienced investors and traders dump their assets and the price receives the last downward impulse before growth.
4. The phase of decline. (Dow did not separately identify this phase in his writings. In Dow's theory, this is the final stage of the distribution phase).
The fourth and final stage in the cycle is the most painful for those who still believed in the price increase. Many are holding them because their assets have fallen below their original amount. It is only when the market is down 50% or more that many of those who bought during the distribution stage or early in the decline give up. "Faith is being killed!" For more experienced traders, on the contrary, it serves as a buy signal and is a sign that the formation of a bottom is inevitable.
_____________________________
4) Choice of cycle time.
An intraday trader who trades relatively small amounts and uses 5-minute candles can see many full cycles per day, while, for example, a positional trader using a weekly or monthly timeframe charts can see several cycles per year (average liquid instruments) or an extended cycle for several years (highly liquid instruments). But he also works in relatively large amounts that are not comparable to a scalper trader.
Your task is to learn how to correctly recognize market cycles on your working timeframe and use it in your trading.
___________________________________
5) Points (zones) of price reversal.
It is necessary to immediately clarify the point (zone) of the price reversal always remains a potential point (zone), because it can act as a continuation of the trend. It is just that in certain zones there is a greater likelihood of a change in price movement than in others. This is very important to understand. Work like a trader, not like a "successful" wang hamster with which the Internet is clogged.
No one knows the exact future. You can identify potential more or less likely price movements and use this in your trading. It is also worth noting that it is not possible to predict everything. It is important that a large number of your forecasts for price movements, thanks to your experience and knowledge, are correctly determined.
Theory without practice is zero! Only your knowledge, modernized to the reality of the market, can give results in practice.

XTZ (Tezos) - Key level broken - 40% upside potentialThe market seems to be recovering and moving from bearish to bullish (in the short term at least)
Tezos has built up 4 touches on a key level and broken through. It's likely we see a retest before lift off. If tezos grows we can aim for a re-test of the previous high. That's a 40% increase and would be a nice catch.
In my opinion Tezos is undervalued compared to other coins and I think we could see real action if the wider market trend starts to accelerate and 40% could just be the beginning.
If we fail to meet this rise upward - we look fairly safe at the $3.15 dollar mark and I would expect it to bounce and consolidate here.
This is not financial advice.
If you enjoyed this analysis please like and follow. Also I'm considering making some videos instead of static analyis and if you'd be interested in seeing these please drop me a comment.

2.000% opportunity XTZ XTZUSDT XTZUSDFollow my updates daily by following my profile to help my portfolio grow, I'm starting and I'm working hard every day to put scenarios here :)
1:
BITFINEX:XTZUSD
2:


Tezos is ready 🚀In this parabolic market, $XTZ is still trading at the same level than 1 year ago.
Do you think it's going to last forever ?
I don't

XTZ false inverted flagSimilarly to the false Inverted Head and Shoulders figure on IOTA , a false inverted flag was formed on XTZ.
Good profits guys!


Tezos (XTZ) - February 25Hello?
Dear traders, nice to meet you.
"Like" is a huge force for me.
By "following" you can always get new information quickly.
Thank you for always supporting me.
-------------------------------------------------- -----
We have to see if we can get support and climb in the 3.3269-3.5936 range.
If you go down from 3.3269 point, you can touch 3.0019 point, so you need Stop Loss to preserve profit or loss.
However, you need to trade carefully as you can touch the uptrend line and go up.
(1W chart)
The 3.3269 point is an important point that separates the highs.
So, if you go down at 3.3269, there is a chance that it could turn into a downtrend.
-------------------------------------------------- -------------------------------------------
** All indicators are lagging indicators.
So, it's important to know that the indicator moves accordingly with the movement of price and volume.
Just for convenience, we are talking upside down for interpretation of the indicators.
** The wRSI_SR indicator is an indicator created by adding settings and options from the existing Stochastic RSI indicator.
Hence, the interpretation is the same as the conventional Stochastic RSI indicator. (K, D line -> R, S line)
** The OBV indicator was re-created by applying a formula from the DepthHouse Trading indicator, an indicator that oh92 disclosed. (Thank you for this.)
** Check support, resistance and abbreviation points.
** Support or resistance is based on the closing price of the 1D chart.
** All explanations are for reference only and do not guarantee profit or loss on investment.
Explanation of abbreviations displayed on the chart
R: A point or section of resistance that requires a response to preserve profits
S-L: Stop Loss point or section
S: A point or segment that can be bought for profit generation as a support point or segment
(Short-term Stop Loss can be said to be a point where profits or losses can be preserved or additionally entered through installment transactions. It is a short-term investment perspective.)
GAP refers to the difference in prices that occurred when the stock market, CME, and BAKKT exchanges were closed because they do not trade 24 hours a day.
G1: Closed price
G2: Market price at the time of opening
(Example) Gap (G1-G2)


🆓Tezos/USDT Analysis (24/2) #XTZ $XTZAfter retesting the support at 3$ and 3.3$ zones, XTZ could recover to retest 4.8$ zone by the Diving Board pattern. We can expect it will break this zone and move up to 5.5$ zone and 7$ zone
Although 3$ zone is the strong support because it is supported by MA200 of 12H timeframe, but if it fails in stop this dump, XTZ may dump to 2$ zone. So you should be careful
📈BUY
-Buy: 3.2-3.4$
-Buy: 2.8-3.0$. SL if B
📉SELL
-Sell: 4.7-4.9$. SL if A
-Sell: 5.4-5.6$. SL if A
-Sell: 6.9-7.1$. SL if A
♻️BACK-UP
-Sell: 2.8-3.0$ if B. SL if A
-Buy: 1.9-2.1$. SL if B
❓Details
Condition A : "If 12H candle closes ABOVE this zone"
Condition B : "If 12H candle closes BELOW this zone"

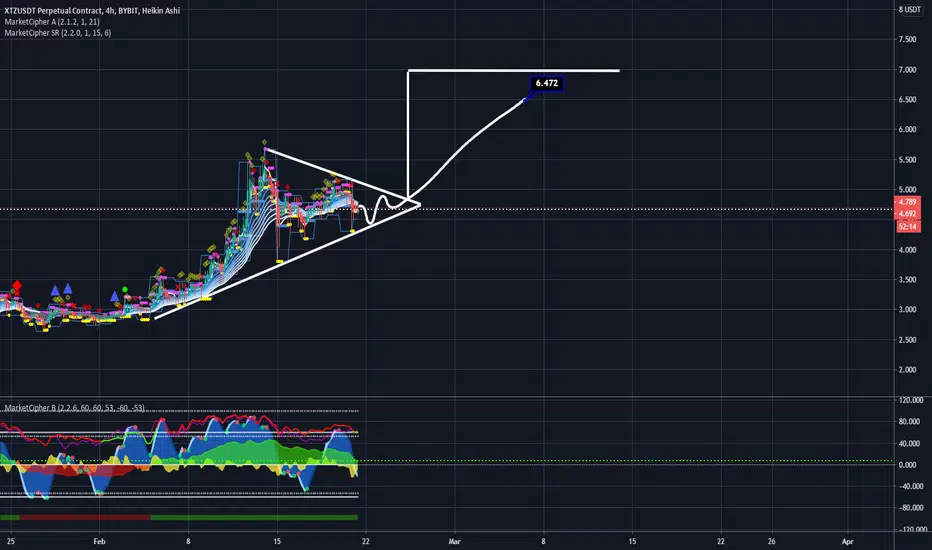
XTZ/USDT huge pump is comingHi every one
TEZOS / TETHERUS
XTZ/USDT has formed an ascending triangle pattern which means after the breaking of this pattern upwardly we shall see a huge amount of increase in the price since this pattern is already broken we can be sure that the projected price movement will make the upward movement and will be as much as the measured price movement (AB=CD)
Traders, if you liked this idea or have your opinion on it, write in the comments, We will be glad.
Things can change...
The markets are always changing and even with all these signals, the market changes tend to be strong and fast!!
Thank you for seeing idea .
Have a nice day and Good luck.


XTZ/USDT : Breakout on triangle BINANCE:XTZUSDT
Hello everyone 😃
XTZ had a breakout from triangle on current candle.
Also MACD have a bullish crossover..
📌 It's better to wait for a confirmation on next 4H candle close above triangle !
Attention: this isn't financial advice we are just trying to help people on their own vision.
Have a good day!
@Helical_Trades

XTZ/USDT : Bearish Divergence on 4H TF BINANCE:XTZUSDT
Hello everyone 😃
XTZ has been rejected from very bullish pattern.
RSI is showing a Bearish divergence.
Also Funding is very high,
So, correction in short-term is expected !
Attention: this isn't financial advice we are just trying to help people on their own vision.
Have a good day!
@Helical_Trades
