XTZUSDT Deep Analysis of Harmonic and ElliotwaveHello Guys,
So Far After Analyzing XTZUSDT Coin i found that its in an uptrend also following the Elliot wave theory very precisely so far.
as per the harmonic is concern if wave 5 hit our HR Target area then odds are high that this harmonic gonna play out.
also there is a Fibonacci time pivot in bitcoin coming at 14th of January so probably yes that matches the theory for the corrective move at that time.
We have untapped daily level above in xtz chart as well.
becarefull this is not a financial advice, also don't overexpose your self to unnecessary risk. do only paper trades untill you become master in the field.
Regards,
Hedgers.
XTZUSDT

XTZVery simple ... Very clear!
Everything is marked on the chart.
This is my personal opinion. Please do not trade based on my analysis and data.

#Tezos Drops to Multi-Year Support Line, resistance $0.911Past Performance of Tezos
It has been a tough year for Tezos, considering how price action has been panning out. As an illustration, XTZ prices are down 91 percent from peaks and presently trading at the October 2019 support. Any loss from the spot rate could see the coin tumble to register multi-year lows, cementing bears' grip on the current trend.
#Tezos Technical Analysis
XTZ bears are squarely in control from a top-down analysis. Even though there are flashes of strength, the coin is tethering close to registering new multi-year lows. Oscillating at October 2019 support at $0.76, Tezos bears are in control. However, in the weekly chart, there are hints of rejection of lower prices. The result is a long lower wick, pointing to strength. In the daily chart, there is a bullish bar following the gains of December 20. Still, buyers are yet to reverse the losses of December 19. XTZ is within a bear breakout formation, with December 16 and 19 defining the current trajectory. Aggressive traders can unload on every attempt higher as long as prices are below $0.911. The immediate target lies at $0.75. This preview will be null if XTZ rallies above $0.911 and, ideally, $1.04.
What to Expect from #XTZ?
Tezos bear bars band along the lower BB, indicating strong selling pressure. With sellers in charge from a volume analysis perspective, traders can liquidate as long as prices are inside the December 16 and 19 bear bars.
Resistance level to watch out for: $0.911
Support level to watch out for: $0.75
Disclaimer: Opinions expressed are not investment advice. Do your research.

xtz update ! the target touched!we have got our target on xtz short position !
now lets go for the next step ...

XTZ tezos about to bottomAt ~.329 we shall see a bottom.
I've been looking over a bunch of altcoins and lots are about to bottom. Happy Holidays!
Get your santa bags ready.

XTZ/BTC Bottom is in?Hi folks, welcome back to RS_Crypto Analysis. It appears that the XTZ/BTC pair has been forming a falling wedge pattern for 1659 days. Based on this analysis, it is possible that the current price represents a bottom for the pair. It is expected that the XTZ/BTC pair may see an upward movement within the next 1-3 months.

Tezos Correction -90% From ATH | Will Grow For 2+ Years After...Tezos (XTZUSDT) has done a massive -90% correction from its All-Time-High and so far hit its November 2019 low levels.
Just a bit lower and XTZ will be trading at All-Time-Lows...
You know what we love to say; Once we hit bottom, the only place left to go is up.
One final drop and the bear market is over for this pair.
It can go lower to a total of -91 to -93%.
After this last move, painful I know, we are very likely to see higher highs and higher lows for years to come.
Over two years of bullish action... All through 2025 and beyond.
Stay strong, the best is yet to come.
Namaste.


XTZUSDT SIGNALHello traders,
Based on the chart, looks like XTZ decided to start growing.
Entry: market and lower
Targets: 1.08 and ~1.15
main target zone: 1.15 - 1.2
after first target reached move ur stop in breakeven!
SL: 0.92
Risk/Reward: 1 to ~3
Good luck!
Please, feel free to share your point of view, write it in the comments below, thanks!

#Tezos down 33% in 3 weeks, XTZ under PressurePast Performance of Tezos
Tezos remains under immense sell pressure, looking at how price action is on the daily chart. Despite the broad market recovery, XTZ is edging lower with support at around $0.90. There are lower lows relative to the lower BB, but sellers remain dominant.
#Tezos Technical Analysis
As an illustration, XTZ is down 33 percent from November peaks and 52 percent lower from Q3 2022 high. Accordingly, sellers are in a commanding position. Therefore, for Tezos bulls to shake off adamant sellers, there must be a decisive close above $1.05 in the short term and $1.20, reversing November 9 losses in the medium term. As long as XTZ prices are below $1.05, sellers can unload on dips, targeting $0.90 and $0.80—or September 2019 range.
What to Expect of #XTZ?
Down roughly 90 percent from the 2021 high, Tezos sellers have unwound all gains of 2021 and 2020. Prices are now at 2019 ranges with a bleak outlook considering the relentless wave of lower lows.
Resistance level to watch out for: $1.05
Support level to watch out for: $0.90
Disclaimer: Opinions expressed are not investment advice. Do your research.

XTZ - 2x OpportunityReposting this since the last chart was removed for some kind of infraction.
Since we reached the level at which I said it's a good idea to accumulate, I thought I'd provide an update with a prediction of where the price can go next. Keep in mind that if you bought here, the best time to sell is end of 2025, but if you want an earlier mid-term target then I think I have a trigger and a set-up for you.
If the price retraces all of the FTX dump and closes above $1.4, then I can see it squeeze up to the area highlighted in red in the chart ($2.8 - $3.2). That means one can buy at 1.4 and 2x within a few months. As I'm sure you all now know, that's pretty much as good as it gets during a bear market. It may even be asking a lot. Keep in mind that if that level is lost, if the price closes below, then this prediction is invalidated. What I mean is that my prediction holds only if we get to and stay above $1.4.
This doesn't just go for XTZ. It's like this for all other altcoins, and includes BTC, too. If they close above the point at which the market began dumping on news from FTX , then they're likely to pump hard. I intend to post a few more charts showing what I mean.
I've been bearish the whole way down, but I think the bear is starting to finally hibernate, and the bulls are beginning to wake up. It'll be slow at first until mid-2024, and then, after the halving, we'll see the bulls rampage again.

XTZ/USD - 2018 bearschizo bros rise up!If we get the brutal 3 year bear run, these are the levels I plan on buying XTZ. Veterans of last bear run would not be shocked if we saw 90-98% drops on major coins, regardless of their fundamentals. Even ETH dumped 94% last time.
This is one of my contingency plans - obviously not advising anyone to follow suit. I still have some alt suicide bags. That said, in my opinion it is a good idea to have cash handy for these possibilities.
Blue - dip toes
Green - long accumulation
Purple - buy with size
(exception is if the project dies, otherwise I think these bags would make me a happy man in the next bull run, especially with baking.)

XTZUSD bear flag 50 % dropXTZUSD is forming the bear flag .
It doesn´t look like xtz formed the bottom like other altcoins did therefore we expect the bear flag to break down.
Speculative setup:
- price in a distribution mode
- wait for a break down to enter the trade
- target: 1 $

#Xtz is in the important Price******* First of all I Should Say Trade with your own Risk*******
XTZ is in the Strong Support Line in 4H Time Frame.
If the Line Support the Price it can goes to the S1,S2,S3
But if it breaks the support Line it can goes deep in the ocean :)
if you see the positive sign you can buy at 6.2 for target 6.6 or 7 in first step.
the RSI Stoch is going to cross from the button.


Say bye to Tezos $XTZXTZ has been building.
Re-test off this bullish flag type scenrio could finally see a breakout on all time frames!
as usual SEND IT

XTZ , Moving towards the resistance zonePrice previously filled the imbalance around $1.48 and moved down from there. I now expect it to keep moving down towards the 30mins demand zone around $1.31 where we would be looking to long from.


XTZUSDT - Tezos Long ideaThe 1.398 resistance was broken. Uptrend is quite strong. Trade is invalid if price goes back below 1.4 USDT
Not financial advise.

XTZUSDTHello Crypto Lovers,
Mars Signals team wishes you high profits.
This is a 4-hour-time frame analysis for XTZUSDT
Here we have R3, R2, and R1 areas as the resistance areas in which the disability of price to rise is obvious. And S1 at the bottom of the chart, is the support line which contains the well support of price at different points. Presently, we have the price fluctuating in S1 area and we believe it will experience a rise up to R2 and by being rejected and having a pullback toward R1, again another increase is waiting for it to higher amounts. If the price falls below R1, more decline is there for it to S1.
Warning: This is just a suggestion and we do not guarantee profits. We advise you to analyze the chart before opening any positions.
Wish you luck

XTZ/USDT - LONG ----- Welcome, dear followers! -----
- Here is my trading methodology. I trade with a normal system and analysis of resistance and support, as well as price reversal patterns.
- For the record, I do not place a stop loss within my trades. So that I only risk 1.5% of my total capital in order to support the loss due to a price reversal against me.
- If a price reversed against my expectation and touched the drawn line r3, then I transferred targets to the entry point and waited for the price to close at it with a loss equal to almost zero.
- Today's deal is shown in the chart, and here are the entry and exit points below.
-- Support me with numbers and follow up on my account for other deals in the future. Thank you for coming to this part. --
-------------------------------------------------------
⚡️⚡️ XTZ/USDT ⚡️⚡️
Exchange: Binance Futures
Trade Type: Breakout (Long)
Leverage: Isolated (1.0X)
Entry Orders:
1) 1.417 - 100.0%
Take-Profit Orders:
1) 1.543 - 70.0%
2) 1.612 - 25.0%
3) 1.72 - 5.0%
Trailing Configuration:
Stop: Breakeven -
Trigger: Target (1)


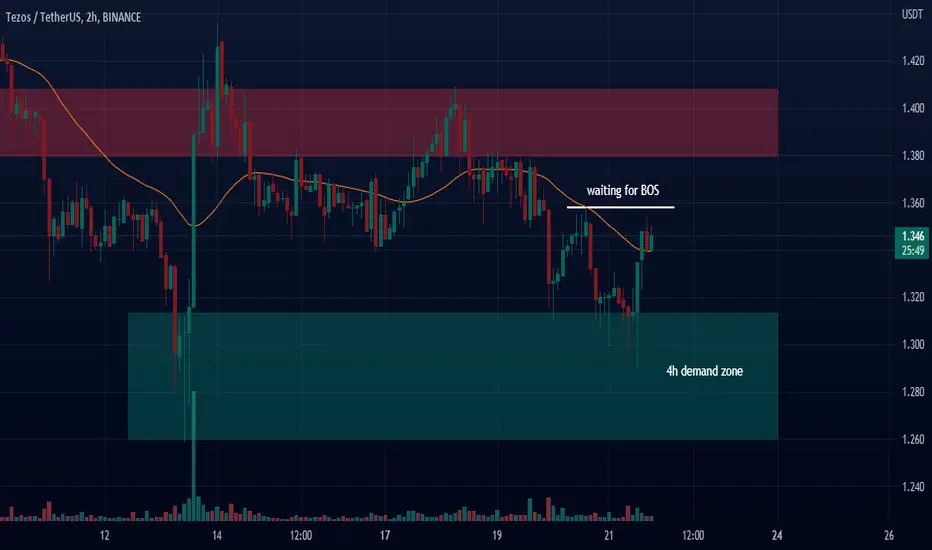
I am waiting for XTZ price to give a clear breakPrice bounced off the 4h demand zone as predicted. I am waiting for price to give a clear break of structure above the previous high before going long for confirmation.