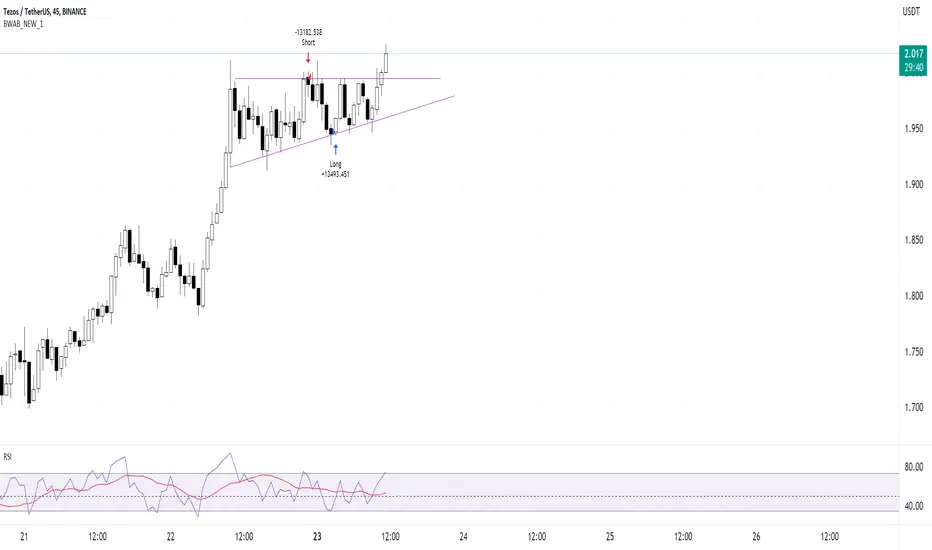
XTZ Channel - educational breakdownThese mini channels that form are usually continuation patterns. The price will fluctuate a little bit within them, maybe touch the bottom or top 3-4 times, before making a break for the up/down side. We like to see them because they continue the trend before it entered this pattern.
In our case, it's coming from a mini rally that started, and then slowly formed into a channel pattern. That means this pattern indicates a continuation of the bullish trend, and hopefully a few higher jumps in price.
All that aside, we have still have to work with our resistance/support zones at all times to see how far the price can move *up or down*.
The two orange lines I've drawn were previous support lines, and it seems to have formed a sort of support, it's not very concrete, but it's definitely using them as mini trendlines. If the price goes higher I think $2.25 is totally reasonable up to $2.4.
If the price goes lower, which sometimes it does, then around $2.04 is the support from the orange line #1.
Let's hope for the best. Our strategy at the moment is indicating a long, and it hasn't suggest a close yet. That strategy is working on momentum oscillators and some other funky stuff
A quick reminder, XTZ is great when Luna is doing bad. Remember my words.
I won't be posting XTZ updates for a bit, as the daily chart given below should cover most of it.
XTZUSDT

📈XTZ: pullback and trap by the whales! Should you open a long?📊Tezos (XTZ) looks stronger than the most of altcoins. After the fall, it almost didn't consolidate and started to grow, which shows high demand.
But a local pullback is possible. How will it happen?
📊The price is now in a triangle and a pullback is possible under the lower boundary of this triangle in order to collect liquidity (stop losses) of long traders below key level $1.76. False breakout return the price in the triangle zone and make short traders, who will open shorts on a breakdown, push the price higher and higher, closing their losing trades.
🚩It's essential to look at volumes. Exactly on the volume indicator we can see the confirmation of our idea. The growth of volumes will show that a large number of trades have been made, which means there is interest from a big player.
✅The first target will be the key level of $2.88.
💻Friends, press the "like"👍 button, write comments and share with your friends - it will be the best THANK YOU.
P.S. Personally, I open an entry if the price shows it according to my strategy.
Always do your analysis before making a trade.

XTZ/USDT Update 📈📉HEY, SUP Guys !
What happened for TEZOS !
In The last analysis that I posted for XTZUSDT , it climbed up to pivot zone but bulls wasn't able to overcome this zone , then it has been declining so far and reached the last lower support lvl ( -60 %🔻 🎯💰 ).
So today as we can see in the 1W time frame for XTZ /USDT , after a huge drop, it has managed itself under the PIVOT zone as a resistance area
and abot the S-R lvl although there is a possibility to decrease again ,but if bulls be able to increase the price on the pivot zone, then according to bar pattern it can rise again and reach higher resistance zones !
but if weekly candle closes blow S-R lvl there is the possibility to retest lower support lvl and then start to rise again from there!!
✌️ Good luck with your trading and investing and remember: Trade smart…OR JUST DON’T TRADE!
--------------------------------------------------------------------------------------------------------------------
👉This analysis is my personal opinion ,not a financial advice ,so do your own research.
💜 if you're a fan of my analyses PLZ follow me and give a big thumbs 👍 OR drop comment 🗯💭

XTZUSDTHello Crypto Lovers,
Mars Signals team wishes you high profits.
This is a 4-hour-time frame analysis for XTZUSDT
According to our previous analysis on May 25, we observe now that the expectation was true and the price faced a decline. Now in this chart, our long-term resistance line (R1) shows the unsuccessful triumphs of the price and at one of its rejections, it lost the previous support area (Now it is R2). S1 line represents the well support of the price at some points and at the present, the price is fluctuating below R1 line. Note that R2 area is the zone the price fluctuates in whenever it breaks R1 line. We expect the price to rise upward to the R2 area and then move above it. Even it may happen that the price loses the support and has a fall and then after a pull back to the S1 line, face more decline toward the S2 area.
Warning: This is just a suggestion and we do not guarantee profits. We advise you to analyze the chart before opening any positions.
Wish you luck

XTZUSDT Still bearish unless the 1D MA200 breaks*** ***
For this particular analysis on TEZOS we are using the XTZUSDT symbol on the Phemex exchange.
*** ***
The idea is on the 1D time-frame where Tezos is shown trading within a Channel Down on the log scale. It has been trading below the 1D MA50 (blue trend-line) since April 07 and despite the May 12 rebound on the Lower Lows trend-line of the Channel, the price still got rejected on the 0.236 Fibonacci retracement level. Those Fibonacci levels have acted as Support/ Resistance levels since the October 2021 High, so this rejection keeps the trend bearish.
Practically, with the price action below the 1D MA50 resembling the sequence of November - mid December 2021, we can claim that only a 1D candle closing above the 1D MA100 (green trend-line) would reverse this bearish trend. That however happened in late March and still Tezos failed to establish a bullish reversal, so it is much safer to wait until the 1D MA200 (orange trend-line) breaks before calling a new Bull Cycle. Until then, it is more likely for the price to keep making Lower Lows.
--------------------------------------------------------------------------------------------------------
Please like, subscribe and share your ideas and charts with the community!
--------------------------------------------------------------------------------------------------------

XTZ LONG IDEABoarded at 667 fib. I don't want to see the price down there anymore. If we come down again, I won't trade it. Next resistance to be expected in the -AOI above. From there, BE and close 50% of the position.

XTZUSDTHello Crypto Lovers,
Mars Signals team wishes you high profits.
This is a 4-hour-time frame analysis for XTZUSDT
The price started its falling trend since April 3, and after forming this long-term resistance line and reaching for at some points, it was not able to move over it and then it was rejected. Also you see the support line at the bottom which shows the support of the price at some points. At the moment, the price is fluctuating on the resistance line and we believe it will continue its falling trend toward the support line and we will have more decline in the price.
Warning: This is just a suggestion and we do not guarantee profits. We advise you to analyze the chart before opening any positions.
Wish you luck

Tezos (XTZ) - May 25hello?
Traders, welcome.
If you "follow", you can always get new information quickly.
Please also click "Like".
Have a nice day.
-------------------------------------
(XTZUSDT 1W Chart)
Anything below 1.942 is likely to be a mid- to long-term investment area.
From a mid- to long-term perspective, to continue the uptrend, it needs to rise above 2.822.
(1D chart)
If support is found above 2.012, it is expected to turn into an uptrend.
(buy)
- After confirming the support in 2.012
(Stop Loss)
- After falling below 1.942 and confirming resistance
- When it falls below 1.769
(Sell)
- When resistance near 2.398
- When receiving resistance near 2.822
If it rises above 2.822, it is expected that full-scale investment will be possible.
-------------------------------------
(XTZBTC 1W Chart)
You must climb over 0.0000 9730 to get out of the bottom section.
------------------------------------------------------------ -----------------------------------------------------
** All indicators are lagging indicators.
Therefore, it is important to be aware that the indicator will move accordingly as price and volume move.
However, for convenience, we are talking in reverse for the interpretation of the indicator.
** The MRHAB-T indicator used in the chart is an indicator of our channel that has not been released yet.
** The OBV indicator was re-created by applying a formula to the DepthHouse Trading indicator, an indicator disclosed by oh92. (Thanks for this.)
** Support or resistance is based on the closing price of the 1D chart.
** All descriptions are for reference only and do not guarantee a profit or loss in investment.
(Short-term Stop Loss can be said to be a point where profit and loss can be preserved or additional entry can be made through split trading. It is a short-term investment perspective.)
---------------------------------

XTZ ascending triangle break upwards. Bullish break, target is $2.2
Overall bullish on the daily time as well.
XTZ Big pump incomingHello Traders!
XTZ has formed a bullish accumulation pattern at the bottom and now it's broken towards the upside.
I am expecting a 38% rise in this bull run.
XTZ Buy limit@ 1.908
Stoploss 1.84(-3.61%)
Target 1, 2.16(+12.8%)
Target 2, 2.36(+23.8%)
Final T.P 2.64(+38%)
Risk management tip,
Use 10% of account max with 10x leverage.

#Tezos Stabilizes, but XTZ Is Bearish Below $2Past Performance of Tezos
Technically, XTZUSDT remains in a bear breakout formation despite recent gains at the tail-end of last week. Tezos is trading at near 2022 lows, posting lower lows versus the USDT when writing. The coin is down four percent in the past 24 hours but at near break-even in the past trading week.
#Tezos Technical Analysis
Presently, XTZ is in a tight $0.05 trade range with clear resistance at $2 and $2.6. In the immediate term, the coin has support at $1.5, flashing with 2022 and last week's lows. Since there are lower lows and prices are within May 12 bear candlesticks, sellers may find entries to liquidate, targeting $1.5 in the short term. On the reverse side, sudden flash gains above $2 may trigger demand, pointing to price reversals (XTZ bottoming) and the current consolidation as accumulation. In that case, XTZ may float to retest Q1 2022 lows of $2.6.
What to Expect from #XTZ?
The primary trend is bearish and XTZUSDT below the middle BB. The failure of buyers to build on last week's gains points to general weakness and dominant sellers. Nonetheless, the tide could shift if XTZ floats above May 12 highs, setting the ball rolling for a possible surge to Q1 2022 lows.
Resistance level to watch out for: $2
Support level to watch out for: $1.5
Disclaimer: Opinions expressed are not investment advice. Do your research.

XTZ at lows - time to buy?There is a lot of potential here as we are near all time low supports, ranging around the ~$1.3 mark. I have outlined the zones in the chart.
The red zone is where there will be a lot of resistance.
Green is the buying zone, and expect volatility here.
The black trendlines are old support lines coming from many years back. It's currently struggling to keep above the lowest line. Once it breaks this going up, it should be face resistance at the other two trendlines.
Is it a good time to buy? Maybe not with your whole bag because BTC crashes are still looming around and it's not showing a lot of bullish strength.
To play it safe, it would be best to buy it when it drops down to around ~1.3 , or if BTC goes past 35.5k.
Otherwise, let's just play it safe and manage your own risk. Leave a comment with your analysis.

Tezos Snaps back, adds 10% but will #XTZ clear $2?Past Performance of Tezos
XTZ prices are printing higher at spot rates, adding 10 percent in the previous trading day. Like the rest of the crypto markets, the coin appears to be finding its footing after deep, double-digit losses of the past trading week. Overall, sellers are still in control though the tide could change in the immediate term if XTZ prices are sustained above this week's lows.
#Tezos Technical Analysis
Tezos bears have been brutal in the past few trading days. As per the arrangement in the daily chart, sellers are still in control. However, the recovery on May 13, reversing the losses of May 12, may signal exhausted bears. Nonetheless, it should be observed that since XTZ prices are within a bear breakout formation below H2 2021 lows at $2, sellers have the upper hand. Optimistic buyers expecting recovery can wait until there is a comprehensive close above $2 before loading on every pullback lower. Conversely, it would be dashing if XTZ slips below $1.4. In that case, there will be confirmation of the May 9 bear breakout, setting the pace for further losses towards $1, registering new 2022 lows.
What to Expect from #XTZ?
Tezos is within a bear breakout formation as per the formation in the daily chart. The reaction at $2 would confirm whether the bear run is over or the current trend will continue.
Resistance level to watch out for: $2
Support level to watch out for: $1.4
Disclaimer: Opinions expressed are not investment advice. Do your research.

XTZUSD Comfortable UptrendConsistent higher lows can be seen on the left chart (coinbase)
Each one of these lows provides a unique support level
The uptrend isn't going anywhere
On the right I demonstrate how price is above a confirmed support level
This will lead to a bounce and return upwards
Bullish

XTZUSDT - potential 144%With green lines, I indicated the reversal week and strong impulses main set of positions will occur now, as well as on the breakdown of upward support from the bottom up and consolidation above the rising global support

XTZ TEZOS is a 75er!Do I smell bottom right here?
Looking at all previous corrections, XTZ has never retraced more than 75% in price. And right now we are at that level again, suggestion take off will be soon!
Hold my beer pls
----
No financial advice, do your own research, don't be stupid

XTZ Daily Review & 2 Possible StoriesXTZ at Daily chart is at very important place named " Liquidity Base "
thats the last base of compression
if it engulf this base we have sell story :)
our confirmation is william PR indicator and Cp moves up and strong weekly Supply above that works perfectly
but it can provides a good buy even it engulf the LqBase
helped by priceaction and RTM & ICT METHODS & ORDERFLOW & SMARTMONEY CONCEPT
sincerely BEARBOURSE

XTZ Long term Trend Line TestingJust drawing and posting this to keep things in mind.
XTZ is on the green line of long term support.
Interesting to see if it holds.

XTZ (TEZOS) UPDATETwo scenario here... after breaking out of the falling wedge price retested and couldn't continue the bull run hence, breakdown, which turns to a descending triangle.
Right now there's no sign of reversal as volume is absent in the market and price could possibly poke out to touch the weekly support trendline.
Hold while we keep watch and update you on the next move.

XTZ | Tezos Clear Bearish TendenciesXTZ has been correcting from its ATH since October 2021. It is like a textbook correction with typical bear market rallies. Tezos is now trading around its main historical support trendline. If XTZ breaks below that, I think we will head towards $2-2.2.
However, given the current level and historical upside impetus from the main support trendline that you can see on the weekly timeframe, another rally is also on the horizon. A break out of the falling wedge would be a first bullish sign. The daily chart would turn bullish once XTZ can again scale above any of the higher dashed white trend lines that acted as resistance in the past.
Considering the volume profile, I tend to lean towards the bearish side on the macro picture.
Let's see how that plays out.
Thank you for your support.

XTZ triangle breakout 📐Tezos broke up this triangle📐 and I think there is chance for run to 5 and even higher. Setting BUY LIMIT order to previous range high to catch🎣 the pullback.
ENTRY : local high @ 3.242
STOPLOSS (SL) : local low @ 2.857
TARGET (TP) : height of the triangle projected from midpoint of the local range (BUY LIMIT - STOPLOSS) @ 5.080
REWARD RISK RATIO (RRR) : 4.7
INVALIDATION : when SL level hit
Check my other stuff in related ideas.
Please like👍, comment🗣️, follow me✒️, enjoy📺!
⚠️Disclaimer: I'm not financial advisor. This is not a financial advice. Do your own due dilingence.

xtzusdtI think we are in a good place for accumulating xtz before going up , in the coming 3 months .

$XTZUSD - Following this scenarioHello everyone!
Tezos is inside this triangle pattern, There is a high chance that XTZUSD will drop to 2.65 - 2.56 areas and bounce back to 3.79.
