XTZUSDT Fibonacci Retest and Rebound Potential: Is Tezos Ready?Detailed Analysis of XTZ/USDT Chart (Daily Timeframe):
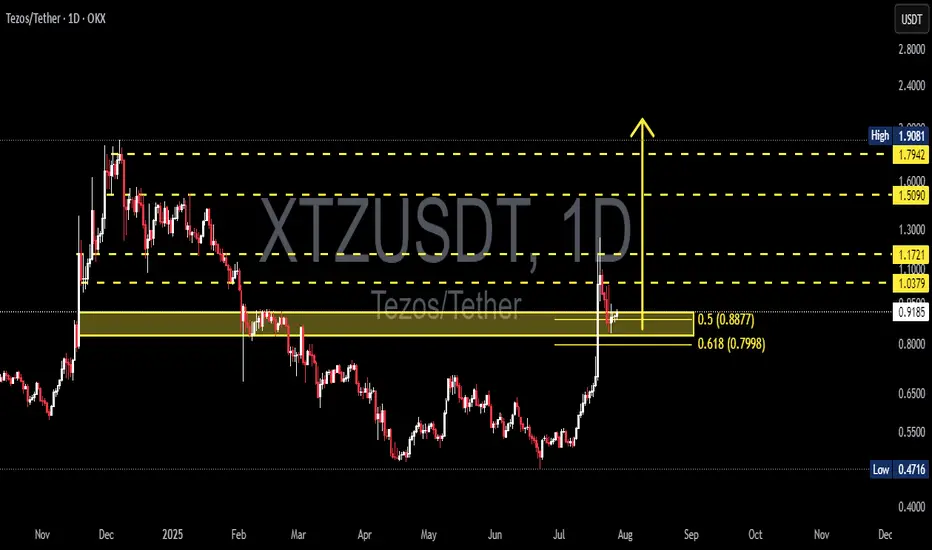
The XTZUSDT pair (Tezos vs USDT) has shown strong momentum following a breakout above previous support zones, with a sharp rally toward $1.17 before retracing.
Currently, the price is testing the Fibonacci Retracement levels, specifically the 0.5 ($0.8877) and 0.618 ($0.7998) zones — which also align with a key previous demand zone. This zone is critical for determining the next directional move.
---
🟢 Bullish Scenario:
If the price holds above the $0.80–$0.88 zone (Fibonacci support area), this could confirm a valid breakout retest.
Potential upside targets include:
$1.0379 (minor resistance)
$1.1721 (recent local high)
Further targets: $1.5090 – $1.7942, and potentially the major high at $1.9081.
This structure may form a bullish continuation pattern, especially if supported by volume.
---
🔴 Bearish Scenario:
A breakdown below $0.7998 may trigger further selling pressure toward $0.70 – $0.65.
A deeper retracement could take price back into the previous accumulation zone between $0.55 – $0.50.
Failure to hold the Fibonacci levels may confirm a bull trap, invalidating the recent breakout.
---
📌 Pattern Insights:
The current price action resembles a Bullish Flag / Retest Structure.
The 0.5–0.618 Fibonacci levels serve as a key confluence area for potential trend continuation.
This is a common setup before a major upside move — if the support holds.
---
Conclusion: XTZ is at a decisive moment. As long as the price stays above $0.80, the bullish trend remains intact. However, a drop below could shift momentum back to the bears. Traders should watch this zone closely for confirmation.
#XTZUSDT #Tezos #CryptoAnalysis #AltcoinSeason #FibonacciRetracement #BreakoutRetest #TechnicalAnalysis #CryptoTrading #BullishScenario #BearishScenario
Xtzusdtperp
XTZ Is Waking Up – Next Stop $2.25?SEED_DONKEYDAN_MARKET_CAP:XTZ is currently bouncing from the lower boundary of a broadening wedge pattern on the weekly chart, signaling a potential trend reversal. This structure, characterized by widening price swings, has been developing since mid-2022.
The recent bullish move has pushed the price above a key resistance zone, with rising volume supporting the momentum. The upper boundary of the wedge aligns with the next major target zone near $2.25.
Resistance 1: $1.00
Resistance 2: $1.45
Resistance 3: $2.25
Cheers
Hexa
BINANCE:XTZUSDT

XTZ/USDT Ready for a Massive Breakout After Prolonged Downtrend!Technical Analysis (1D Timeframe):
The XTZ/USDT pair is forming a well-defined descending triangle pattern, with sustained selling pressure since late 2024. However, the price action is now signaling a potential breakout as it approaches the apex of the triangle, supported by a strong accumulation zone around $0.4720–$0.5247.
🔍 Analysis Details:
Descending Trendline Resistance: Price has repeatedly failed to break above the descending resistance line since December 2024. It is now testing the edge of the triangle, which typically precedes a significant breakout.
Strong Support Zone: The consolidation zone between $0.4720 and $0.5247 has acted as a key accumulation area, successfully holding off bearish momentum.
Potential Breakout: A breakout above the triangle resistance, especially with confirmation above $0.5797, could trigger a strong bullish rally toward the next resistance levels.
🎯 Target Resistances (Upon Confirmed Breakout):
1. $0.5797 – Initial breakout confirmation
2. $0.6326 – Minor resistance
3. $0.7281 – Significant resistance from previous structure
4. $0.9145 – Medium-term bullish target
5. $1.0445 – Strong resistance zone
6. $1.2022 – Final breakout target
⚠️ Note:
A valid breakout requires a daily candle close above the descending trendline, ideally supported by volume confirmation. A pullback to the breakout zone may occur and could offer a second entry opportunity.
#XTZ #Tezos #XTZUSDT #CryptoBreakout #DescendingTriangle #AltcoinAnalysis #TechnicalAnalysis #CryptoSignals #TrendReversal #BullishSetup

XTZUSDT 1D AnalysisXTZ ~ 1D Analysis
#XTZ Buy after successfully penetrating this resistant line with a short -term target of at least 10%+.

XTZUSDT 1WXTZ ~ 1W Analysis
#XTZ Buy gradually from here with a short -term target of at least 20%+
Reason, This is the lowest support for now which is continuously maintained.

XTZUSDT 1WXTZ ~ 1W Analysis
#XTZ This is the lowest support block for now. buy gradually from here with a minimum target of 20%+

XTZUSDT 1WXTZ Update ~ 1W
#XTZ Still maintains its Bullish structure from here. Buy in stages from here. With a target of at least 20%+ from here.

Tezos XTZ price “finally” shoot outOldies here?) Do you remember that there was such a coin as #XTZ ?)
Yes - yes - this is the “stick” that shoots once a year and falls 3y)
It's hard to believe that the current growth of the OKX:XTZUSDT price will be above $1.58-1.78
Therefore, this idea will probably be more interesting for #Tezos holders
Although.... maybe we don't know something about the bright future of this project ?)
_____________________
Did you like our analysis? Leave a comment, like, and follow to get more

#XTZ/USDT#XTZ
The price is moving in a 4-hour channel and sticking to it well
The price rebounded well from the lower border of its neck at the green support level of 0.910
We have a tendency to stabilize above the Moving Average 100
We have oversold resistance on the RSI indicator to support the rise, with a downtrend about to break higher
Entry price is 0.910
The first goal is 0.980
Second goal 1.053
Third goal 1.12
Fourth goal 1.20

XTZ/USDT: Preparing for a Strong Bullish MoveXtz/usdt is showing strong bullish potential as it breaks out of its consolidation box on the weekly time frame. This breakout could signal the start of a significant upward trend, especially since these box patterns have been performing well in recent setups.
Key observations:
- The breakout above the box indicates a shift in momentum, with buyers gaining control.
- Momentum indicators such as RSI and MACD are turning positive, adding confidence to the bullish case.
- Increased volume during the breakout is a sign of strong market participation.
Tips for trading xtz/usdt:
1. Wait for confirmation of the breakout with a daily candle close above the consolidation box.
2. A retest of the box's upper boundary as support can provide a safer entry point.
3. Keep an eye on trading volume; a low-volume breakout may indicate a lack of conviction.
4. Set stop-loss levels below the breakout zone to manage risk effectively.
5. Define clear profit-taking levels based on prior resistance zones or Fibonacci extensions.
Potential targets:
- First target: .
- Second target: .
This analysis is for educational purposes only. Always trade with proper risk management and conduct your own research.

XTZUSDTXTZ ~ 1W
#XTZ Do you still have Conviction on this coin? If yes, this support Block would be a very good buy for now. at least for 20%++

Where To #XTZ/USDT?Can #XTZ Bulls defend the 0.6500 psychological level?
IMO: #XTZ/USDT could be the next interest for the bulls. Price crashed to a potential buy Liquidity zone. I am bullish

Tezos XTZUSDT price is at a critical point, where to go next?Here is the whole trading history of the once quite popular pair XTZUSDT
The XTZ price grew skillfully during 2019-2021 from $0.35 to $9
And then a stable downward trend, which has been going on for more than a year
Now the XTZUSD price is at a critical point.
If buyers can gain a foothold above $0.75 , there will be a good chance of working out the blue scenario. In the medium term, it is the growth to the liquidity zone of $1.20-1.80
If sellers do not meet resistance from Tezos buyers, and the XTZUSDT price is confidently fixed below $0.75, then the next purchase zone is not earlier than $0.46-0.56
_____________________
Did you like our analysis? Leave a comment, like, and follow to get more

XTZ/BTC Bottom is in?Hi folks, welcome back to RS_Crypto Analysis. It appears that the XTZ/BTC pair has been forming a falling wedge pattern for 1659 days. Based on this analysis, it is possible that the current price represents a bottom for the pair. It is expected that the XTZ/BTC pair may see an upward movement within the next 1-3 months.

XTZ/USDT - LONG ----- Welcome, dear followers! -----
- Here is my trading methodology. I trade with a normal system and analysis of resistance and support, as well as price reversal patterns.
- For the record, I do not place a stop loss within my trades. So that I only risk 1.5% of my total capital in order to support the loss due to a price reversal against me.
- If a price reversed against my expectation and touched the drawn line r3, then I transferred targets to the entry point and waited for the price to close at it with a loss equal to almost zero.
- Today's deal is shown in the chart, and here are the entry and exit points below.
-- Support me with numbers and follow up on my account for other deals in the future. Thank you for coming to this part. --
-------------------------------------------------------
⚡️⚡️ XTZ/USDT ⚡️⚡️
Exchange: Binance Futures
Trade Type: Breakout (Long)
Leverage: Isolated (1.0X)
Entry Orders:
1) 1.417 - 100.0%
Take-Profit Orders:
1) 1.543 - 70.0%
2) 1.612 - 25.0%
3) 1.72 - 5.0%
Trailing Configuration:
Stop: Breakeven -
Trigger: Target (1)

🟢 XTZUSDT - 4H (19.09.2022)🟢 XTZUSDT
TF: 4H
Side: Long
Pattern: Double Bottom + Bull Flag
Entry: $1.4329
SL: $1.4010
TP 1: $1.4912
TP 2: $1.5420
TP 3: $1.5831
TP 4: $1.6242
This thing will fly as it's at strong support now.

XTZUSDT Long SignalXTZUSDT has made some clear moves in the near-past and it has confirmed the Short term confirmation, which is clearly seen in the chart. It's just a matter of time for it to gain momentum and go sky-rocketing in the upward direction. I am fully bullish on XTZUSDT and currently my setup for $XTZ is as follows:
Entries : 1.21 - 1.40
One time Entry: 1.34
Short Term: 1.42 - 1.52 - 1.60 - 1.72 - 1.85 - 1.94
Mid Term: 2.10 - 2.48 - 2.93 - 3.58 - 4.72 - 6.08
1.08 - 1.02 (Trailing)
Please be aware with your money!

XTZUSDT bias 📉🌱A bear trend spotted on the H1 filter chart so now we will be looking for possible sell opportunities. XTZUSDT having two possible patterns before moving to the downside. Let's see how it goes. #notafinancialadvice

XTZUSDT: Bearish Channeling, Bearish Bias doesn't end yet?Hello Fellow Tezos Coin Investor/Trader, Here's a Technical outlook of XTZUSDT!
Support our content by smashing the like and follow button, you also can share your opinion in the comment section below.
XTZUSDT is creating a bearish channeling. Furthermore, The MACD indicator created a death cross, which confirmed a potential downside momentum to the target area.
All explanations are presented on the chart.
The roadmap will be invalid after reaching the target/resistance area.
"Disclaimer: The outlook is only for educational purposes, not a recommendation to buy or sell the cryptocurrency"

XTZ pattern breakout XTZ / USDT
Price broke-out the bullish pattern on its fifth try
the overall market still in bear/ sideway
However this is bullish momentum for XTZ
if price able to hold above resistance line for next few hours expecting more bullish movements and first resistance is around 2.55$ (first TP )
Best of wishes

XTZ Big pump incomingHello Traders!
XTZ has formed a bullish accumulation pattern at the bottom and now it's broken towards the upside.
I am expecting a 38% rise in this bull run.
XTZ Buy limit@ 1.908
Stoploss 1.84(-3.61%)
Target 1, 2.16(+12.8%)
Target 2, 2.36(+23.8%)
Final T.P 2.64(+38%)
Risk management tip,
Use 10% of account max with 10x leverage.

XTZ Daily Review & 2 Possible StoriesXTZ at Daily chart is at very important place named " Liquidity Base "
thats the last base of compression
if it engulf this base we have sell story :)
our confirmation is william PR indicator and Cp moves up and strong weekly Supply above that works perfectly
but it can provides a good buy even it engulf the LqBase
helped by priceaction and RTM & ICT METHODS & ORDERFLOW & SMARTMONEY CONCEPT
sincerely BEARBOURSE

