XVG/USDT — Symmetrical Triangle at Apex: Breakout?Pattern & Overview
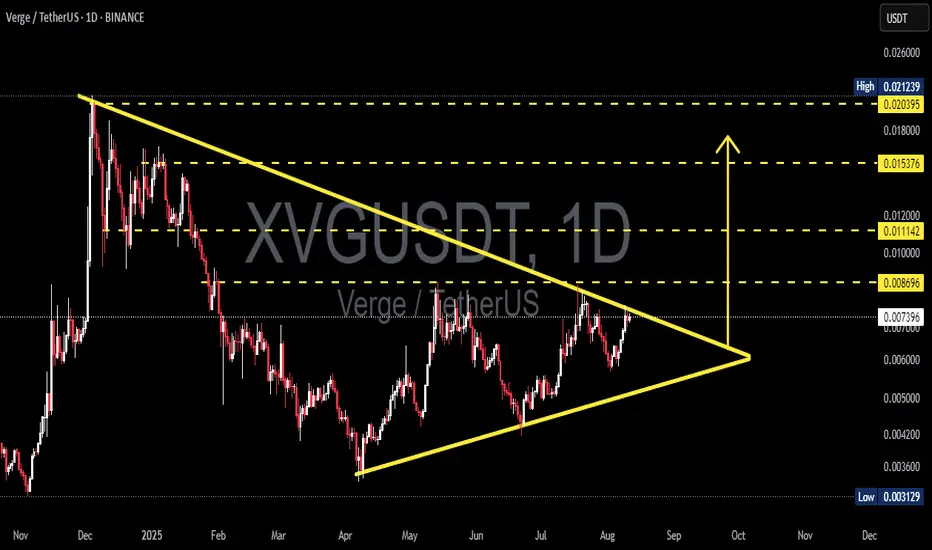
The XVG/USDT daily chart is forming a symmetrical triangle — descending resistance from the Dec 2024 high and ascending support from the April 2025 low. Price is now around 0.00743 USDT, nearing the apex, indicating reduced volatility and an increased chance of a sharp breakout soon.
Pattern characteristics:
Higher lows (rising support line) suggest accumulation.
Lower highs (descending resistance) indicate continued supply overhead.
Volume usually contracts within the pattern; a valid breakout is often confirmed by a volume spike.
---
Key Levels (marked on chart)
Resistances / potential upside targets: 0.008696 (immediate), 0.011142, 0.015376, 0.020395, up to ~0.02124 (high).
Critical supports / breakdown levels: ascending trendline (~0.005–0.0055 zone) and historical low at 0.00313.
---
Bullish Scenario (confirmation & targets)
Confirmation: daily close above the descending resistance + increased buy volume. Ideally, wait for a daily close above 0.0080–0.0087 (breakout zone) before adding positions.
Measured targets (from current ~0.007428):
Target 1: 0.008696 → +≈17.1%
Target 2: 0.011142 → +≈50.0%
Target 3: 0.015376 → +≈107.0%
Example trade plan:
Conservative entry: after daily close > 0.0087.
Conservative stop: below breakout retest / under 0.0066 → stop ≈ -11.15%; R:R to Target 1 ≈ 1.5:1, to Target 2 ≈ 4.5:1.
Aggressive entry: buy now (~0.00743), stop below ascending trendline (~0.0055) → stop ≈ -25.96%; R:R to Target 1 ≈ 0.66:1 (higher risk).
---
Bearish Scenario (confirmation & targets)
Confirmation: daily close below the ascending trendline (~0.005–0.0055 zone) with increased sell volume. If confirmed, price could drop toward:
First support: 0.0050 → ≈-32.7% from current price.
Strong support: 0.0042 → ≈-43.5%.
Worst-case retest of historical low: 0.00313 → ≈-57.9%.
Short/Cut-loss strategy: wait for a confirmed close below support, then enter on a pullback/retest with stop above the retest level.
---
Risk Management
Symmetrical triangles can have false breakouts — always wait for confirmation (daily close + volume).
Limit risk per trade (e.g., 1–2% of capital). Adjust position size based on stop distance.
Take profits in stages: e.g., 30–50% at first resistance, another 30% at second resistance, trail the rest.
Keep an eye on news, listings, or on-chain events — crypto reacts strongly to short-term fundamentals.
> XVG is forming a contracting symmetrical triangle on the daily chart. Higher lows vs. lower highs — price is approaching the apex.
Bullish: daily close above 0.0080–0.0087 with volume → targets 0.0087 / 0.0111 / 0.0154 (+17% / +50% / +107% approx).
Bearish: daily close below rising support (~0.005–0.0055) → possible drop to 0.005 / 0.0042 / 0.00313 (-26% to -58% approx).
Wait for confirmation, manage your risk, and scale out profits. 📉📈
#XVG #Verge #XVGUSDT #Crypto #TechnicalAnalysis #Triangle #Breakout #Altcoins #RiskManagement
Xvgusdidea
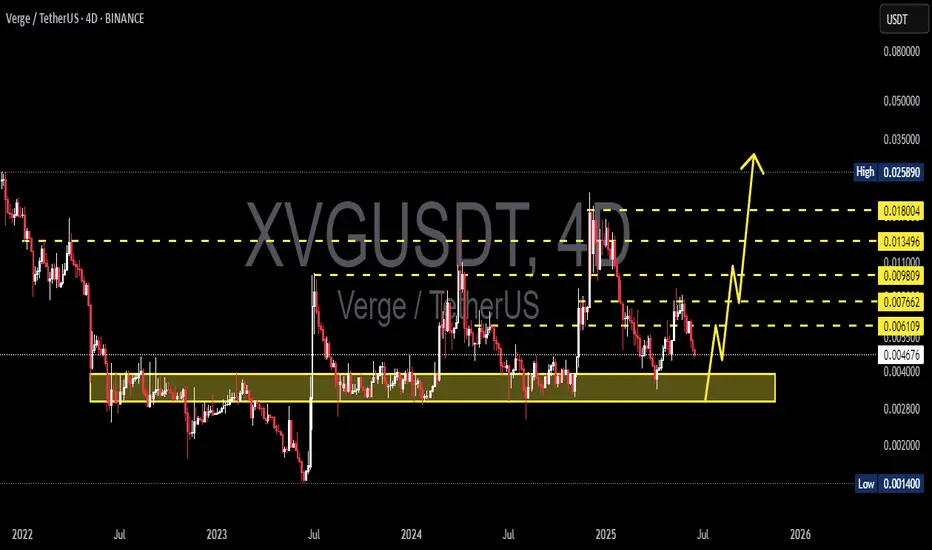
XVGUSDT 4D AnalysisXVG ~ 4D Analysis
#XVG Buy back on retest of this support block with short term target of at least 20%+ from this support.
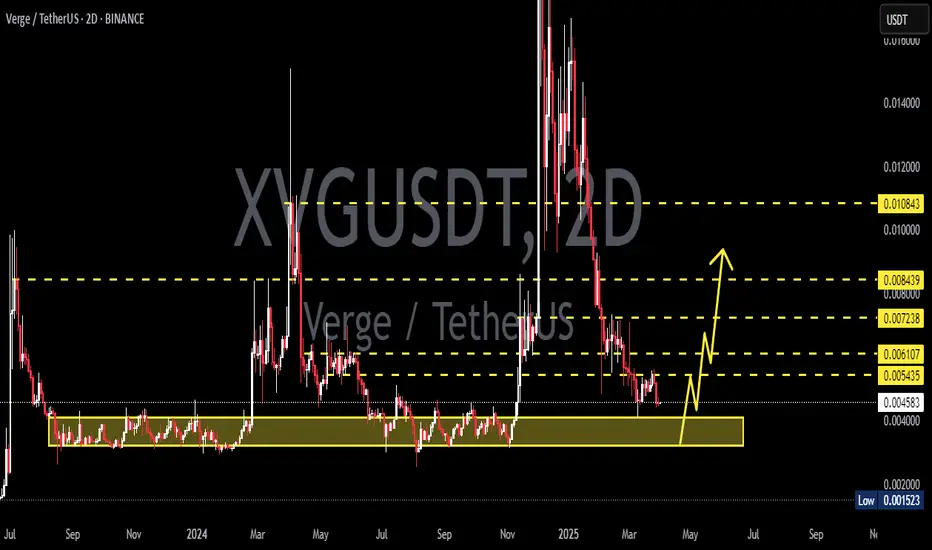
XVGUSDT 2DXVG ~ 2D Analysis
#XVG Buy gradually from here with a short -term target of at least 15%+. This is the previous accumulation area.
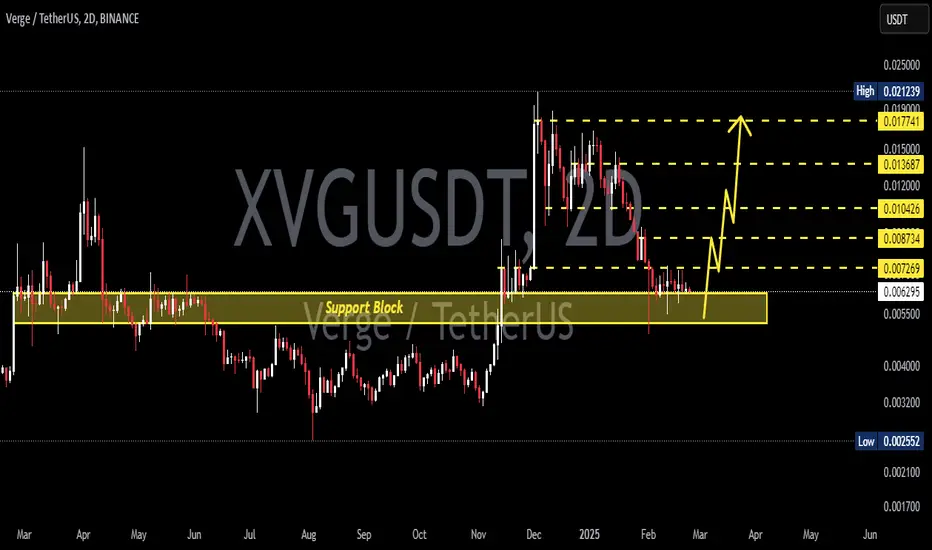
XVGUSDT 2DXVG ~ 2D Analysis
#XVG Support blocks that you might be able to consider to start buying back from here. with a minimum target of 15%+
XVGUSDT 1WXVG ~ 1W
#XVG So far it continues to maintain its bullish structure. Buy when retesting this Golden Ratio,. Minimum target 20%+

XVG / XVGUSDTGood Luck >>
• Warning •
Any deal I share does not mean that I am forcing you to enter into it, you enter in with your full risk, because I'll not gain any profits with you in the end.
The risk management of the position must comply with the stop loss.
(I am not sharing financial or investment advice, you should do your own research for your money.)

Verge (XVG) formed bullish BAT for upto 41% pumpHi dear friends, hope you are well and welcome to the new trade setup of Verge (XVG) coin.
Previously we caught a nice trade of XVG as below, and after a quite long-time I am sharing the next trade plan for XVG.
Now on a 4-hr time frame, XVG has formed a bullish BAT move for the next price reversal move.
Note: Above idea is for educational purpose only. It is advised to diversify and strictly follow the stop loss, and don't get stuck with trade

XVGUSDT, Its amazing ...Hello everybody
Whats up guys ?
We finally show one of our coin in portfolio that we are speaking about it, Mr.Abtin is one the Verge maximalist trader.
If you want to learn Fundamental & Technical analysis send us messages ---> Our id is in profile
(Only for 48hours you can buy any package with 51% discount)
According to the chart, we shown the trend of the market and now as you can see the last rally that made now Wave A and B was completed and we expect the price should reach to the PRZ Level that we shown on chart and in there zone Wave C can be completed and it can be the point of swing for change trend.
The price can rise up to 0.018$ and after that can be drop and reach to the PRZ Level.
If you have any question send us messages
Good Luck
Abtin


XVGUSD completing last leg of shark | Upto 159% profit potentialThe price action is completing the shark pattern and soon it will be entered in PRZ area after completed the C to D leg.
The RSI on week chart is already oversold.
Volume profile showing no interest of traders at this area.
Soon the price line will take bullish divergence from potential reversal zone to hit the sell targets inha Allah.
The targets are:
Buy between: 0.00592853 to 0.004455
Sell between: 0.00790637 to 0.01155651
Regards,
Atif Akbar (moon333)
