XVG USDT main volume levelMostly for personal use - not investment advise !!!
Main resistance levels
Prediction for braking bear market run
Short term 2022 only indicators
XVGUSDT

Xvg Long term revised charton weekly time frame i have mentioned important levels to look at closely and i think wave 2 is completed. for wave 3 we need some confirmations RSI should be above 50 level and Stoch RSI blue line should be above on orange line.
tp1 0.00422812,
tp2 0.00475031
tp3 0.00550061
Support me Guys…………………..
BTC ADDRESS 0xacb8d25ae58176bed1e8cf7a1512ff536da68738
BNB ADDRESS 0xacb8d25ae58176bed1e8cf7a1512ff536da68738

#XVG - potential massive breakoutXVG moves in range for a long time. Coin has not liquidity, so we can see rapid pump in near future. If you want to try trade this situation, put limits at showed levels.

XVG Bankruptcy!XVG , Bankruptcy was announced
It is expected that there will be a heavy fall ahead
We have to wait
If the support lines are broken, a sharp fall is coming

XVGUSDT - BULLISH SIGNAL UPDATE!!As you all know, XVG is not performing well from last 16 weeks and according to the Chart patterns, Decending Channel is formed, Breakout formation is also nearly there and also indicators giving bullish signal.
DYOR Before taking trade, as I'm not responsible for your loss.
RISK FACTORS:
Market/ BTC CRASH
Duration:
MID-Term (3 - 10 Months) Trade.
Happy Trading :)
Good Luck!
If you like my idea, please support:
Binance Smart Chain ( BSC ): 0x69Ea86D0f6B762fC36A322b0C833D2bd04534b3d

XVGUSD Updated ViewAn updated view for XVGUSD on the Monthly timeframe showing a green down trend line that should be bought once broken above
A double Top can be viewed on this Logarithmic chart, allowing the formation of the red down channel


Long XVG/BTCxvg currently in the 12 months downtrend ! 1 years , not 1 month!
Xvg has been accumulated for a long time

long idea XVG/btcxvg has a big potential! 10x from the current price, in 6 or 12 months.
do your own research!
Have a good day

$XVG 33% SoonXVG Buy now @ 0.0136$
Sell @ 0.018$
We can see a now there is a wedge and the chart did Bear trap and no we are seeing an upward momentum to the target specified.
Used Method:
Fibonacci
Wedge

XVG Long OpportunityXVG Long Opportunity check it up check it up check it up check it up check it up check it up

XVG deserves 300% pumpIt has been boring, side-way action for XVG.
Whales have made sure the weak-hand is completely out of XVG.
Now they will start to make the move. They pushed price back up to test supply. Make sure retailers happy with 20% pumps and get out of XVG.
Div on daily.
I believe XVG deserves 300% pumps. Whales go hunting for low cap, easy to pump and dump so XVG is a good choice.
When whales decide to pump a coin, oh boy. It's gonna be at top gainers for weeks like $RUNE, $WAVE, $LUNA, $KNC, $ANC.
Good luck out there VergeFarm.
NFA.

Verge After 60% Growth (We Are Getting Closer To...)We are getting closer to our target... This is how the XVGUSDT (Verge) pair is looking after 60%+ growth...
We can clearly see prices now trading above EMA100.
The next target is marked yellow on this chart.
Here is the previous analysis before the initial price jump:
Even though it is already moving, there can be much more
Namaste.

Verge Going For 150% Potential WaveVerge (XVGUSDT) is growing vs Tether... Things are starting to look good.
Notice the down-trendline, it has been completely broken followed by a higher low... Now prices are moving above EMA50 which can lead to additional growth.
The target is on the chart.
Namaste.

XVGUSD Alligator RepetitionThe alligator indicator can be seen to on this monthly timeframe acting very similar to it did in the past (green box's)
Will the green candles follow? I do hope so


🔝 XVGBTC & XVGUSD 💥My strategy in this trade is simple. I will Alocate 2% of the porfolio in this trade because we have a cheaper price than 5 years ago and close to All Time Low (after May 2017). I will Sell 20% everytime it goes up 40% vs USD (20% of the total amount at that point and not 20% of the initial value). I will Hold if goes down. My main goal is fixed value price but a trend line price wich means the target will increase daily with the same rate as the slope of the trend line on the chart linking the lasts peaks (if I was not clear here you can just ask me in the comments area or message. PS: My automatic strategy is optimized for 4h charts. It is shown in the 1D graph just to show you the "big picture".

XVGUSDTHello Crypto Lovers,
Mars Signals team wishes you high profits.
We are in the 4-hour time frame. The price is close to its first resistance and if rejected, it can fall down to the support zone which has previously supported the price. If the resistance line is broken, it can move up to the next resistance zone. We had better wait for the price to reach either the support zone or the resistance zone and then enter the trade. However, if the first resistance line is broken, we can enter the trade there too for the next resistance zone.
Warning: This is just a suggestion and we do not guarantee profits. We advise you to analyze the chart before opening any positions.
Wish you luck

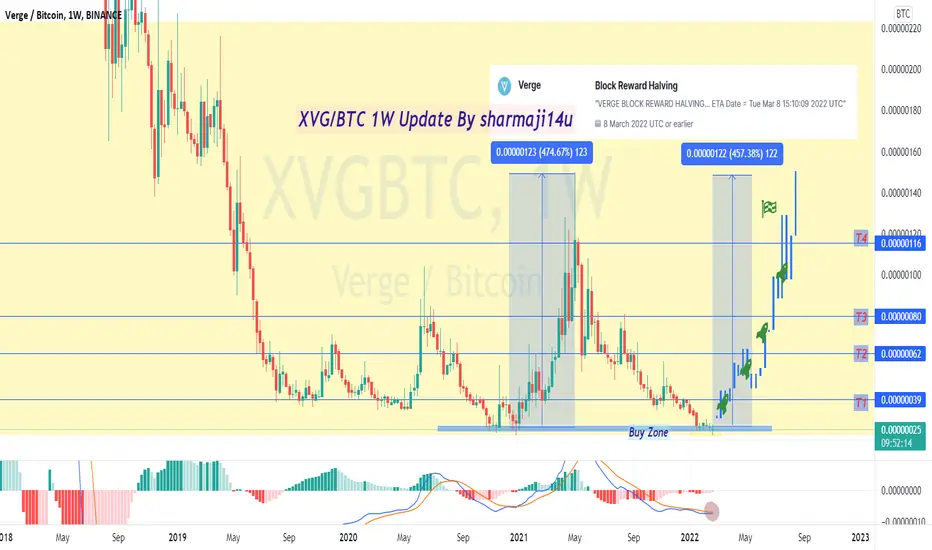
XVG/BTC 1W Chart Update XVG/BTC 1W Chart Update by sharmaji14u
Profit Near 457%
Hello Dear Freinds....
XVG still in support in 1W chart and accumulate
MACD also near Crossover
Big news next month March Verge Halving is coming.
So Don't Miss This Big Opportunity
Entry & Target in Chart
I hope freinds you understand my analysis.
Me & my Team trying to best analysis for you Freinds.
~~Please Support Freinds~~
(Not Financial Advice)
~~Best Of Luck~~
!! Thank You My Team !!