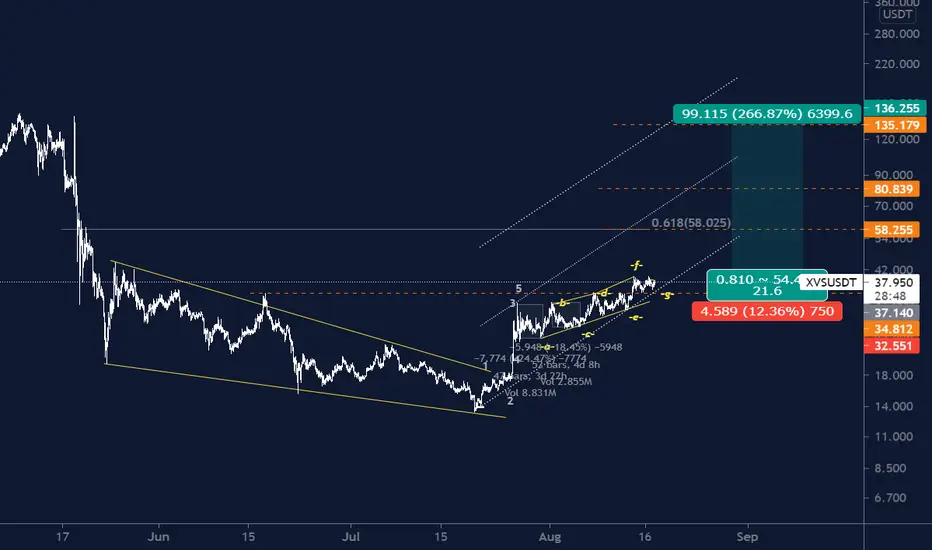
XVS usd has grown 30% from my predicted buy point since Aug 10I'm always looking for Chart with the earliest signs of pumping for the community and XVS is one of them
XVS has grown 30% from my predicted buy point since Aug 10
It will hit target soon
Xvsusdt

XVSUSDT_LONGEverything is clear on the chart... Of course I've two scenarios in mind but this one has a nice r/r. So even if I top out of it, it's still a good trade
XVS/BTCwhen we see chart dollar $XVS we tell ourselves>OH MY GOD!!! WHY DIDN`T I FIND OUT SOONER
NOW $XVS/BTC IS SO BULLISH.
Venus one of my favorite coins.
2H/4H
have nice day!
@PRO4SSOR

Venus XVS Caution! Roller coaster is not for the faint of heart!Venus (XVS) is an algorithmic money market and synthetic stablecoin protocol launched exclusively on Binance Smart Chain (BSC).
The combination of Defi project + binding to Binance gave a good result, the price of XVSUSDT increased from $2 to almost $150
But the real roller coaster for traders happened on May 18-19, then the price for 2 hours increased from $80 to $140 . (Against the background of purchases to get a new VRT reward token) and already during May 19, the price of XVSUSD fell from $140 to $32. Only spot traders could survive such a ride, while the deposits of marginals were confidently multiplied by 0.
Tonight, against the background of the BTC shot up, the price of XVS also showed an increase, although much better +50%
Such volatility is very dangerous to trade on a margin account, only on a spot.
By the way, the white route from our idea BTCUSDT worked pretty well
The weekly candle has worked out almost all its growth potential in a day
Let's define the key levels:
To continue the upward rally, the XVSUSDT price needs to be corrected, at least up to $20
The first target for growth is $35, if it is easily overcome, then hello $59-60.
Correction: here we will have to look at how powerful the growth will be and what the overall situation will be in the crypto market.
However, based on the current data, we believe that in the future it will be possible to place buckets for purchases on the spot in the liquidity zone of $10-11 . What if we get lucky and pour it, who knows what they have prepared for us in the future)
_____________________
Since 2016 , we have been analyzing and trading the cryptocurrency market.
We transform our knowledge, trading moods and experience into ideas. Each "like under the idea" boosts the level of our happiness by 0.05% . If we help you to be calmer and richer - help us to be happier :)

XVS In Neutral Zone , Buy After Breakout #XVS 1D Chart Analysis... Most Requested
After A Big XVS Goes 85% Down From It's All Time High. After A Long Corretion XVS Goes Below It's Strong Support Zone. After That XVS Created A Bullish Engulfing Candlestick & Closed Above Support Zone. But Next Couple Of Daily Candle Tried To Close Above The Bullish Engulfing Candelistick High. Serially All 4 Candles Failed To Close Above The Bullish Candle. Now We Are In Sideways Until It's Close Above or Below The Bullish Candle. That's It ... I Will Suggest Don't Take Entry Without Breakout.

Xvs - best pick for this bullrunXvs is the best pick to scoop up. It is for dca not for quick gains.


XVS - 2X OPPORTUNITY - EXTREMELY LOW PRICEThe price of the Xvs coin fell sharply, uncommonly, after a sharp rise.
After this hard fall, an "inverse head and shoulder" pattern may appear.
If this pattern works, the price could rise to the $ 90 level within 1 week.
Enjoy the extremely low price.


XVS/USDTBreaking out from the bull flag , targeting 1.618 FIB area ( around $158 )
Expect to hit in short term.


XVSUSDT Hello to you all. Mars Signals team wishes you high profits at all times.
We have drawn a support line for you that if that line is lost, the price will lose its power, but as long as it fluctuates above that line, we will enter into a trade for the above goals.
Warning: This is just a suggestion to you and we do not guarantee profits.
Wish you luck!


Xvsusdt Waiting For breakoutXvs is forming an ascending flag after break out we will see another highs in it
Thanks

XVS CAN TOCH NEW ATHIf the price can break the resistance level of $ 90 and stabilize in the lower time frames above this price, we can have a good buy...
However, we also pay attention to bitcoin price fluctuations and dominance movements...

XVSUSDT showed steady growth.As we can see, the previous idea worked 100% successfully, it was a real rocket and the price soared from $ 73 to $ 120, (+ 64% profit in 2 days). Thanks to everyone who listened to me and earned money with me. My profit was + $ 10,000.
Now XVSUSDT is trading in the range of $ 105-115, let's see where the price goes.
If you like the idea, subscribe and like it.
Good luck and big profits.

