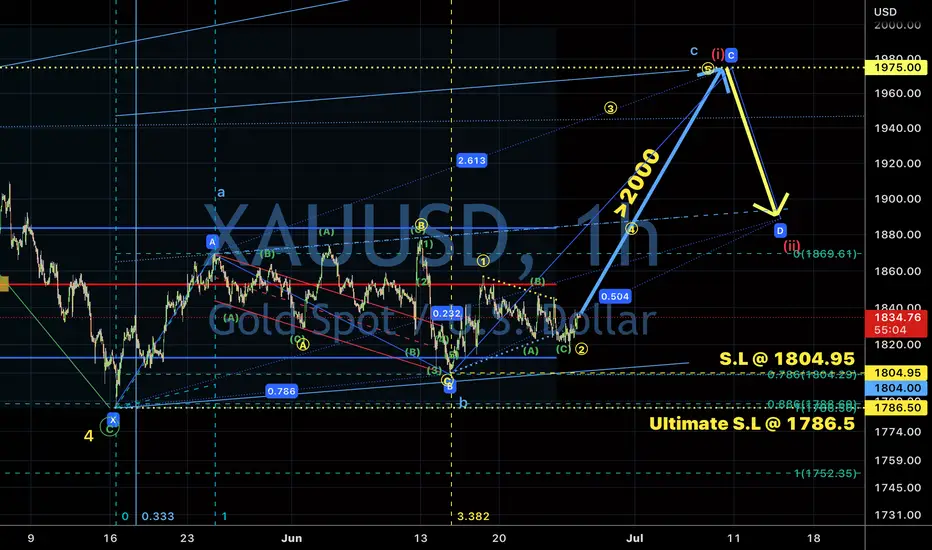
Gold’s 1800 strong support. 2/July/22.Gold possible found strong support @ around 1800 as shown on volume profile POC and daily pin bar/ candlestick shooting star pattern. Possible an deep pullback from last leg of expanding flat pattern in wave C (yellow) toward around 1920..
Xyz3dtrading

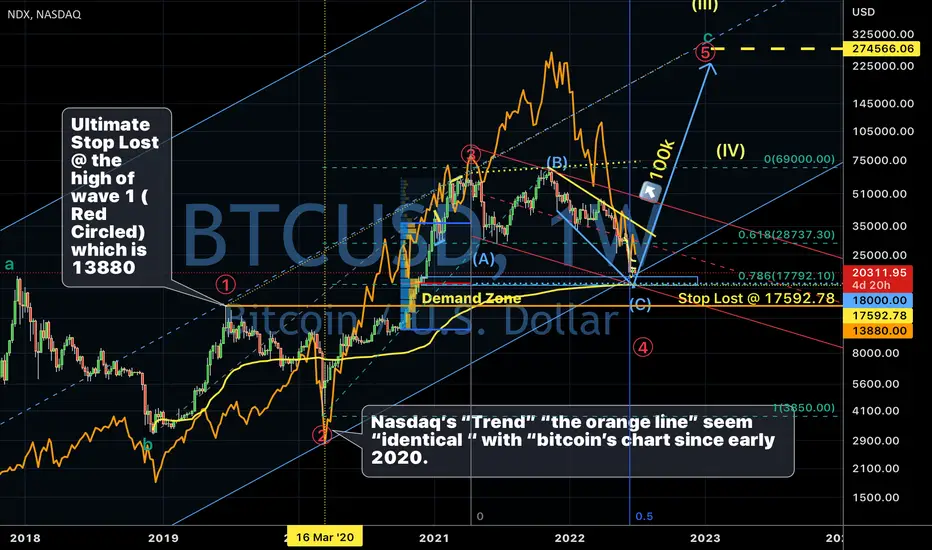
Bitcoin Quasimodo & fibo time/price setup. 1/July/22.Bitcoin. Will it break below 17592.78?! To be “honest”.. I”m “not sure”. (Pls dun argue with me, argue with yourself ..and Mr. Market . Thank You!) AND I will “not sure” for any of my trading setup “found” in future. BUT What I’m “sure” are 1) where is my trade setup “invalidation” level of my #StopLost ( where most indicators based/ mechanical system traders are “not sure” or never / dunno where is the stop lost level) ..2) where is my #TargetProfit.. with min risk/reward ratio of 1 : 2 ( e.g risk from $1 to make $2) = this is hardly achievable In scalping/intraday trading unless you are beginner and “train yourself for shooting more bullet” OR u like giving more “commissions “ to your broker, signal provider etc....

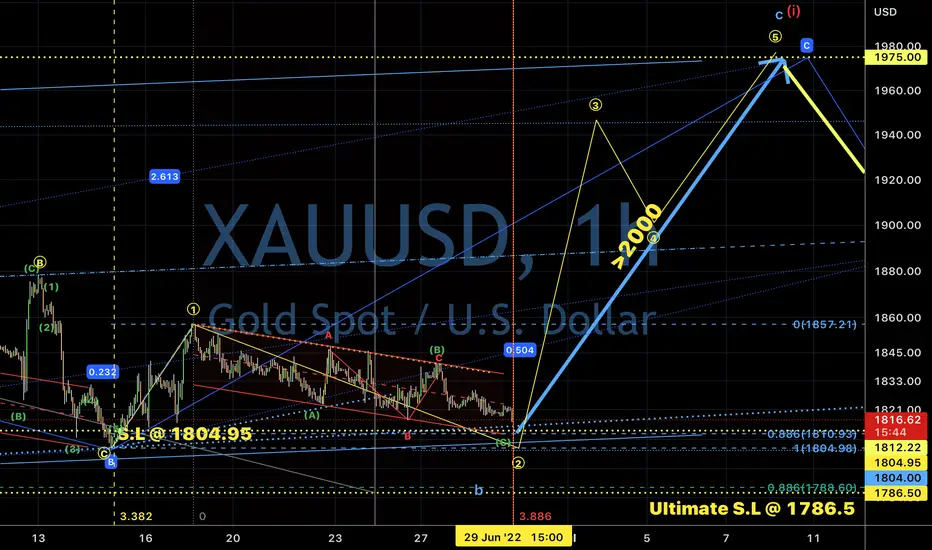
Gold’s Quasimodo & fibo time/price setup. 1/July/22Gold. Will it break below 1786.50?! To be “honest”.. I”m “not sure”. (Pls dun argue with me, argue with yourself ..and Mr. Market . Thank You!) AND I will “not sure” for any of my trading setup “found” in future. BUT What I’m “sure” are 1) where is my trade setup “invalidation” level of my #StopLost ( where most indicators based/ mechanical system traders are “not sure” or never / dunno where is the stop lost level) ..2) where is my #TargetProfit.. with min risk/reward ratio of 1 : 2 ( e.g risk from $1 to make $2) = this is hardly achievable In scalping/intraday trading unless you are beginner and “train yourself for shooting more bullet” OR u like giving more “commissions “ to your broker, signal provider etc....


Bitcoin. When Fibonacci time/price met. 29/June//22Bitcoin most likely “found” its “bottom” as last idea. As its price downward price movement probably “stalled” at Fibonacci price 0.786 << measured from point 2 ( Circled Red) to point (B)( cyan/light blue)>>.. AND Fibonacci time 0.5 << projected from point a (green) to point 3 (Circled Red).>>.
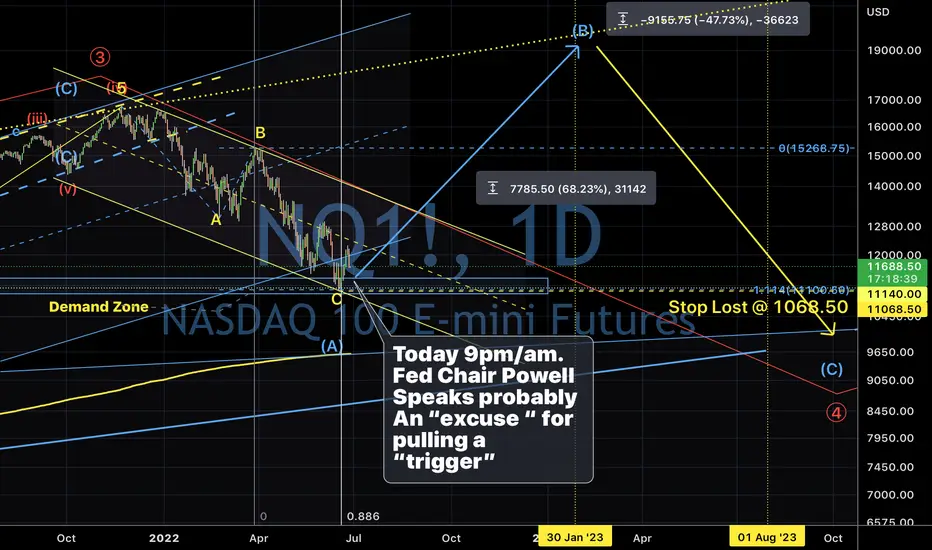
Nasdaq. When Fibonacci time/price met. 29/June/22Nasdaq most likely “found” its “bottom” as previous posted idea. Nasdaq Price probably start building its “base” for upward “rally” when its wave C (yellow) of Fibonacci time = 0.886 of wave A (yellow) “matched up” with Wave C (yellow) Fibonacci price = 1.114 of wave A (yellow)..

Digi. When fibo time/price met..23/June/22Digi ( with Average dividend 4-5%)..May “found” its “bottom” when fibo 0.618 ( time / on around late June/early July) met 0.382 ( price / ) at around Rm3.00.. potential of >60% growth..

BrentCrudeOil short term updated 21/June/221)On Charts : Charts consist of 3-Dimensions - The X-factor ( Time or Cycle ), The Y- factor ( Price Geometry ), AND The Z-factor ( The Speed ).. 2)On Elliot Wave / Market Structure : Unlike Textbook written rule : ALL Impulsive wave comprise of ONLY a-b-c sub-waves NOT 1,2,3,4,5 waves.. AND there is NO Truncated 5th wave BUT ONLY wrong wave counts...
Disclaimer

Palm and crude oil long term bullish? R u sure?! 21/June/221)On Charts : Charts consist of 3-Dimensions - The X-factor ( Time or Cycle ), The Y- factor ( Price Geometry ), AND The Z-factor ( The Speed ).. 2)On Elliot Wave / Market Structure : Unlike Textbook written rule : ALL Impulsive wave comprise of ONLY a-b-c sub-waves NOT 1,2,3,4,5 waves.. AND there is NO Truncated 5th wave BUT ONLY wrong wave counts...
Disclaimer

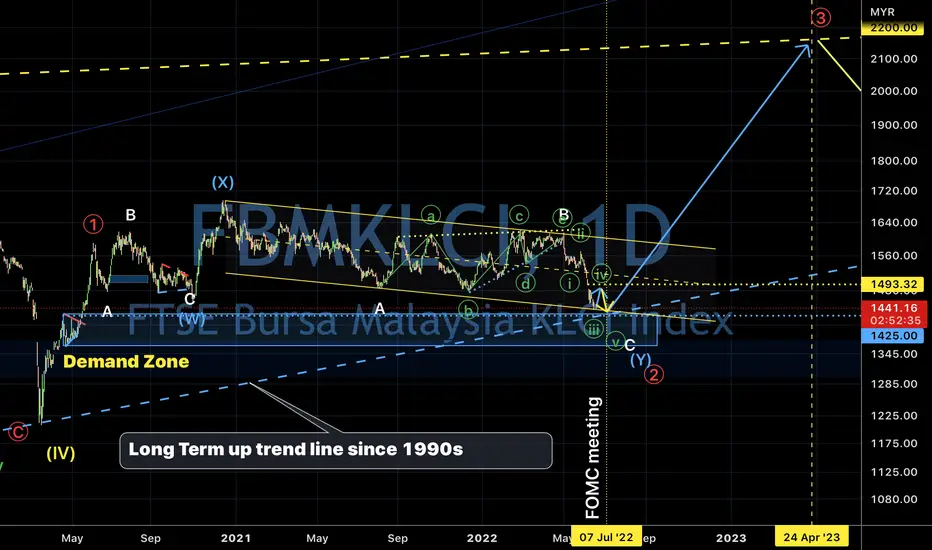
KLCI May only “bottom” at around 1425 on early July. 20/June/22KLCI. Reviewing Fmbklci’s waves structure. Possible forming a complex double three pattern which is (W)(X)(Y)( cyan/ light blue instead of triangle pattern on previous idea.

NIO maybe “reaching” $37-$38 ONLy. 19/ June/22NIO possible found its “temporary “ base as its monthly chart forming a pin bar/ doji candle stick bullish pattern. Price could trending up to around $37-$38 which is next 1) major supply zone 2) Upper Downward trendline resistance of Parallel Channel (yellow line)

Harta’s “base” maybe @ around Rm2.37. 19/ June/22Disclaimer : All past, present, future chart analysis are for illustration, research, studies purpose ONLY.. Harta/ Hartalega May still yet to found its “footing/base” at around Rm2.37-Rm2.38..before having “very deep” “pullback “ from downtrend .possible reaching @ around Rm15..

Kossan possible breaking ATH of 7.90 But 0.90 first. 19/June/22Disclaimer : All past, present, future chart analysis are for illustration, research, studies purpose ONLY.. Kossan among 4 kings of gloves stocks. Kossan have a potential breaking its all time high ( ATH ) Rm7.90 from coming “rally “..unlike others 3 kings ( harta, Topglove, supermx) its current downward wave structure from ATH seem “comprised of “ 3 waves structure which is (A)(B)(C) ( cyan/light blue). Meant its “correction” might be done soon BUT yet need to find its base first maybe @ around Rm0.90..

Supermx may found its “base” soon. 19/ June/22Disclaimer : All past, present, future charts are all for illustration, research, studies purpose ONLY.. Supermx May start building its base soon before deep pullback from “downtrend “ as price now @ 1) major demand Zone 2) Major up trend line ( Cyan dashed line )..

Nasdaq “so far” has been “dumped “ for 33.99%..17/June/22Nasdaq after -33.99% “drawdown “..”officially “.has been “declared “ as “small crash” ..Most traders probably now at “extreme” “low” level before “euphoria” for ATH ( All Time high ) again? until forgot...BUT. maybe “the worst” yet still waiting to “come”..Another “pump” and more “heavyweight” “dump” probably 50% waiting?!

Bitcoin. Where “bottom”? Answer worth of millions! 17/Jun/22Bitcoin. The question million of traders asked might be where could its “base/bottom” built before rallying up to 100k?. Maybe the answer is 18000. where “all” meet..1) The Lower trendline ( cyan/ light blue) of wedge pattern 2) POC of Volume Profile ( Red Horizontal line) 3) VWAP ( yellow MA line ). 4) Demand Zone.. AND good luck! In your trading!

Nasdaq probably last leg down. 16/ June/22.Nasdaq probably on its last leg down toward around 11140 after US 0.75% rate hike..AND. completing its bearish correction since 22 Nov 2021.

Nasdaq and “great wall”. 15/June/22Nasdaq weekly chart and “the Great Wall” = comprises of 3ema 233 (Fibonacci) ( high, low, median) Average curve Great Wall...Will it hold the “ invaders “ this time?

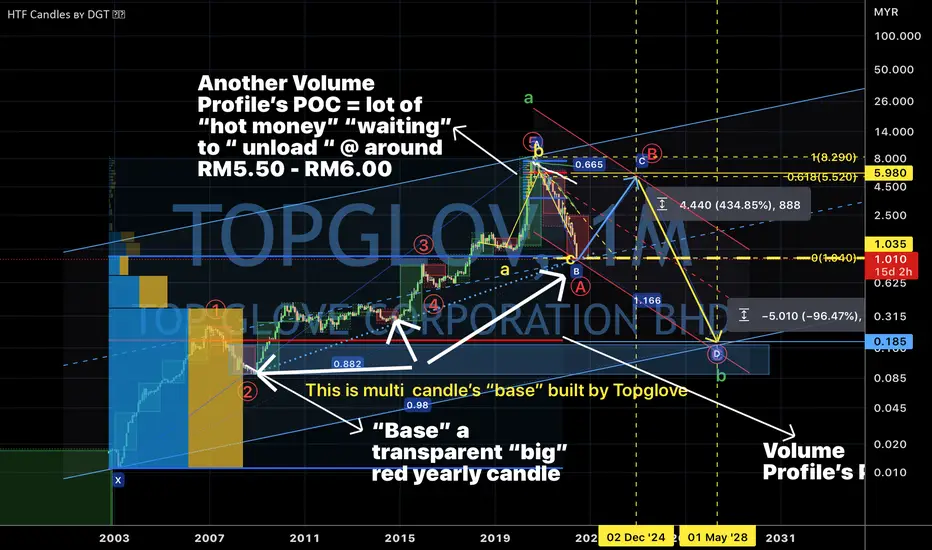
Topglove May <Rm 0.2 BUT maybe RM5-Rm6 first. 15/June/22Disclaimer : All past, current, future analysis are purely for “entertainment, research, studies” purpose only..TOPGLOVE. after “reviewing “ its price’s structure the initial expanding abc ( yellow) waves pattern idea which might “finished “ its “bearish correction “ most likely won’t happen. The current downward price movement from all time high look more like an downward impulsive 5 waves which is wave A ( Red Circled).. So..so.. there is a high “possibility” that Topglove will have another “deeper” leg down which is wave C ( Red Circled) where Price could ONLY “complete “ its “long term” correction probably @ around RM0.185. !!!!!??? BUT..but wave B ( Red Circled ) could “retrace” “ up to” around RM5.50 - RM6 which is Fibonacci 0.618 and Volume Profile POC....
Gold watch out! 1800! 15/June/22Gold possible forming an expanding flat pattern ABC ( yellow circled) as on chart. Price may “reverse “ right before/after FOMC possible 0.75 or even 1.0000 rate hike?!...@ around 1800 which is QM level and 3 drives pattern....or tell us what “ any interesting chart pattern “ you “ have discovered” ? E.g harmonic chart pattern etc...
