DATAPRP Elliot Waves updated 9/Feb/22DATAPRP by breaking RM0.70 major demand zone. DATAPRP stock price might taking longer time to complete bigger size of triangle pattern in wave (4) (cyan/light blue). Price now "seating" @ the major up trend line ( cyan/light blue dotted) if monthly price bar closed below the up trend line price may moving down toward next demand zone @ around RM0.180
Xyz3dtrading

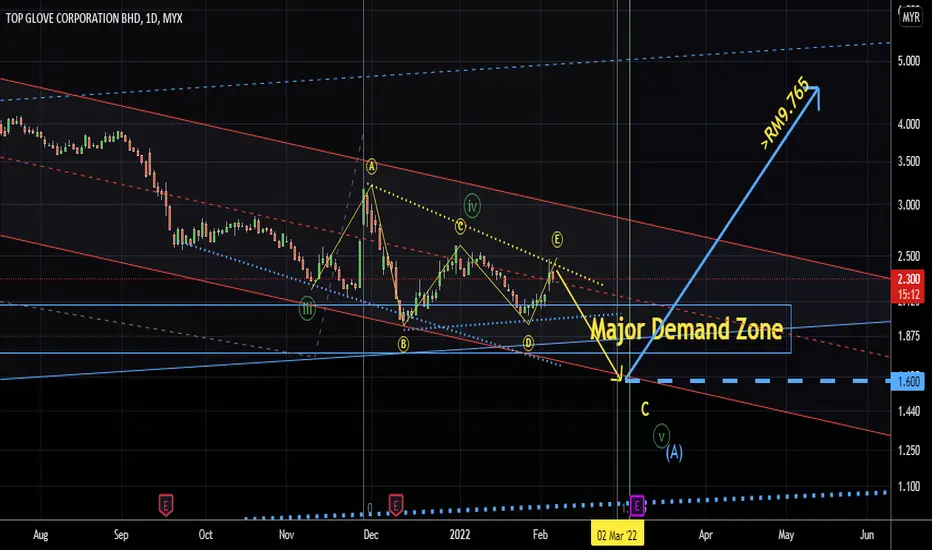
TOPGLOV possible on last leg of correction. 8/Feb/22TOPGLOVE. I've look back topglove's price structure, there is a high probability that it has just completed its wave E (Yellow circled) of a triangle pattern which happen most of the on wave 4 where most of the time the last waves of "correction" . That meant also TOPGLOV might on its last waves down toward around 1.600 before major "BULLISH REVERSAL! " probably just right after or before the 9 March 20222 1st Quarter Earning Report Announcement.
TOPGLOV maybe forming a triangle pattern. 7/Feb/22TOPGLOVE possible forming a triangle pattern in wave iv ( cyan / light blue ). Major reversal could be "delayed/dragged" until late of March 2022 after First Quarter Earning Report for 2022 on 9 Mar 2022..

NVIDIA medium term outlook. 6/Feb/22NVIDIA possible forming a triangle in wave 4 (yellow).. Where price of wave E of triangle (not shown on chart ) may stalled at around 245. Up Side Target potential could be at around 1400 ( 471.43% growth)..@ the upper resistance line of parallel channel (white)

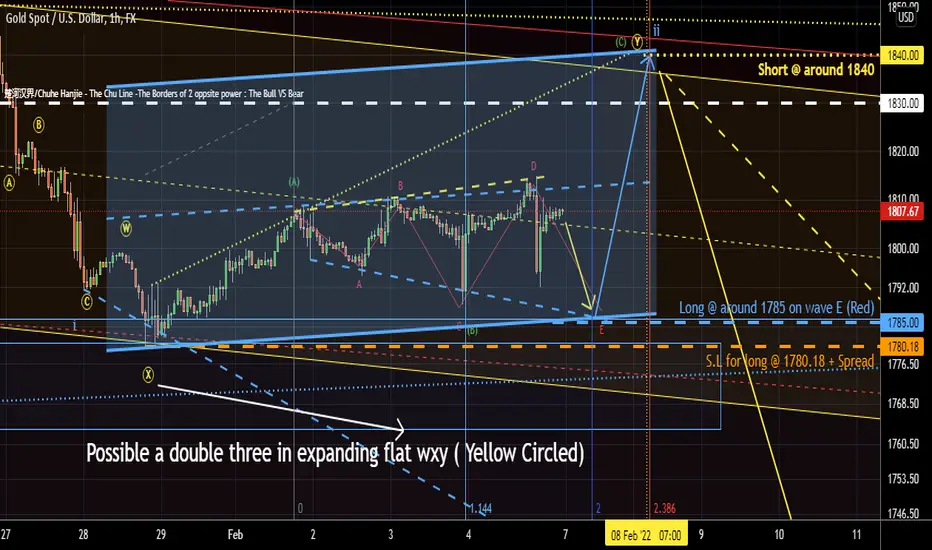
GOLD expanding triangle possible uncompleted. 5/Feb/22GOLD's checking from GOLD's Fibonacci time travel on wave (B)(Green) could be 2 X of wave (A)(Green). PLUS GOLD price couldn't closed above the median line ( Dashed Line ) of the parallel channel. GOLD's price could reach the lower support line of the parallel channel again to completed its expanding triangle pattern.
GBPJPY almost hitting 160. 5/Feb/22GBPJPY approaching 160 :_ 1) a zone of long term supply and 2) Upper resistance line of long term parallel channel (yellow) ...which maybe the terminal for wave 4 (Red Circled) of A Flat Pattern.

Facebook/Meta forming a triangle pattern ? 5/Feb/22Facebook / Meta possible forming an expanding flat or triangle pattern.. For The Long Term Bull to defeat the Bear. The 198.48 Benchmark possible need to be hold..

BrentCrudeOil maybe around 125? 5/Feb/22UKOIL aka Brent Crude Oil maybe on its last leg up toward around 125 ::- a major supply zone .. AND maybe the terminal of Wave 2 (Red Circled) which is possible an expanding flat pattern..

Gold. How Market Maker "make money" by "Stop Hunting!". 4/Feb/22GOLD possible forming a expanding triangle in wave (B) ( Green). As statistic : markets trend 30% (ONLY) of the time and they are range bound 70% of the time.. Market Maker have the "Edge Odds" on "unlimited bullet/Funds" AND probably unlimited "Patience/Time" over "retail traders" which when "market maker" have "70%" of time to "hunt" "retail traders" during "ranging market"...

GOLD short term updated 3/Feb/221)On Charts : Charts consist of 3-Dimensions - The X-factor ( Time or Cycle ), The Y- factor ( Price Geometry ), AND The Z-factor ( The Speed ).. 2)On Elliot Wave / Market Structure : Unlike Textbook written rule : ALL Impulsive wave comprise of ONLY a-b-c sub-waves NOT 1,2,3,4,5 waves.. AND there is NO Truncated 5th wave BUT ONLY wrong wave counts...

Dollar Index 101 is "critical resistance". 1/Feb/22As EURUSD. Dollar Index may form a triangle. At around 101 region ..possible a terminal for wave D (yellow of triangle) ...

EURUSD medium term outlook. Updated 1/Feb/22EURUSD possible on wave C (Red Circled) of triangle where price could reach at around 1.1000..

BITCOIN possible forming an ending diagonal. 1/Feb/22BTCUSD possible forming an ending diagonal in wave c (green circled) of an running flat pattern. .P/S : On Elliot Wave / Market Structure : Unlike Textbook written rule : ALL Impulsive wave comprised of ONLY a-b-c sub-waves NOT 1,2,3,4,5 waves

GOLD, We may @ wave A (Circled) ONLY of exp. flat. 1/Feb/22GOLD, we possible at wave A ( Yellow Circled) ONLY of the expanding flat ABC (Yellow Circled). ..P/S : On Elliot Wave / Market Structure : Unlike Textbook written rule : ALL Impulsive wave comprised of ONLY a-b-c sub-waves NOT 1,2,3,4,5 waves

GOLD's 1830 -The Chu Line Separating the bull & bear. 28/Jan/22GOLD's 1830 -The Chu Line Separating the bull & bear. 28/Jan/22.. GOLD's price may found its temporary "base" for wave i (cyan) @ around 1790..Where 1790 are : 1) POC of volume profite 2) Demand Zone 3)Up trend line support. As we're catching the "falling knife".. Traders may have to "reduce" their position size to at least 1/3 of "normal size" as trading against current "down trend".

GOLD Uptrend Friend Was Bent! 27/Jan/22Gold Price have Broken 1834.72 which is the low of wave E (Red) of triangle. Confirmed Trend Reversal. Short at around 1840 which is the "peak" of the volume profile + Quasimodo level.

KLCI's "diamond" seem still on process of polishing. 26/Jan/22KLCI future index price movement seem still in ranging stage where its "diamond / triangle " shape haven't formed yet for its to "Shine"?!!!

INARI maybe only "worth" to buy @ ≈ 2.75. 26/Jan/22INARI's stock price may still "dropping" until around 2.75. The next major demand zone and lower trend line support of possible a triangle pattern.

GOLD on last leg up for expanding flat (a)(b)(c)(Red). 26/Jan/22P/S. There is NO Alternative waves counts BUT either 1 and ONLY "Main" wave counts or "Wrong" waves counts.... Gold probably on the last leg up for the wave (c)(Red) Impulsive move since 15 Dec 2021 which is also the last leg of an expanding flat (a)(b)(c)(Red). Assuming the waves/ expanding flat pattern is valid. Price of GOLD "should be" Capped "Below" -- 1876.95 !!!

EURO possible forming triple bottom. 25/Jan/22EURO stock's price currently seating near @ Long Term Parallel Channel (Cyan) Median Line ( Dashed Line ) possible forming a triple bottom near the long term demand zone.

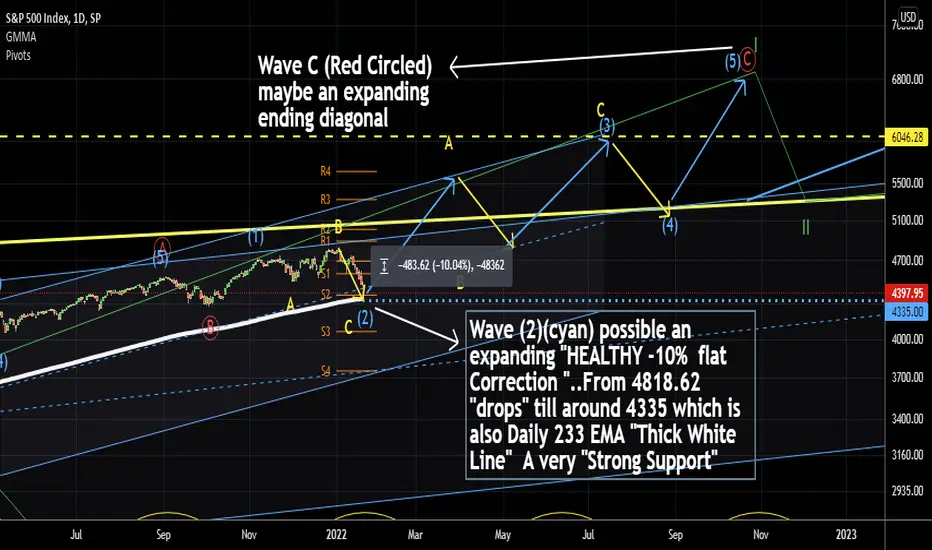
SPX possible an expanding triangle. 25/Jan/22Since Price have broken previous low of wave (1)(cyan) @ 4278.94.. I have re-view my counts from expanding flat to possible an expanding triangle..

GOLD maybe a contracting triangle. 25/Jan/221)On Charts : Charts consist of 3-Dimensions - The X-factor ( Time or Cycle ), The Y- factor ( Price Geometry ), AND The Z-factor ( The Speed ).. 2)On Elliot Wave / Market Structure : Unlike Textbook written rule : ALL Impulsive wave comprise of ONLY a-b-c sub-waves NOT 1,2,3,4,5 waves.. AND there is NO Truncated 5th wave BUT ONLY wrong wave counts...

SPX may done " 10% correction" @ ≈4335. 24/Jan/22P/S : SPX. As I don't trade index nor do I need to "Hedge" against like those Fund Manages's "huge" long term stocks portfolio collection for the sake of "big draw down" .. I only "Follow-up" index Once a while as "a gauge" for "overall individuals stock" "healthy timing measurement" ..whether to "collect" or "dispose" individual stocks...