Fundamental Market Analysis for July 3, 2025 USDJPYEvent to pay attention to today:
15:30 EET. USD - Non-Farm Employment Change
15:30 EET. USD - Unemployment Rate
15:30 EET. USD - Unemployment Claims
17:00 EET. USD - ISM Services PMI
The Japanese Yen (JPY) traded with a slight positive bias against the bearish US Dollar (USD) during the Asian session on Thursday and remains near the near one-month peak reached earlier this week. Despite the Bank of Japan's (BoJ) hesitation to hike rates, investors seem convinced that the central bank will remain on the path of normalizing monetary policy amid rising inflation in Japan. This is a significant divergence from the stance of other major central banks (including the U.S. Federal Reserve (Fed)), which are leaning towards a softer approach, and is favorable for lower JPY yields.
Meanwhile, US President Donald Trump hinted at a possible end to trade talks with Japan, and also threatened new tariffs against Japan over its perceived reluctance to buy American-grown rice. This, along with the overall positive tone towards risk, is a headwind for the safe-haven yen. In addition, traders seem reluctant and prefer to take a wait-and-see approach ahead of today's release of the closely watched US Non-Farm Payrolls (NFP) report. The crucial data will play a key role in influencing the US Dollar (USD) and will give a significant boost to the USD/JPY pair.
Trade recommendation: BUY 144.00, SL 143.00, TP 145.40
Yen

GBP/JPY H4 | Pullback support at 38.2% Fibonacci retracementGBP/JPY is falling towards a pullback support and could potentially bounce off this level to climb higher.
Buy entry is at 196.78 which is a pullback support that aligns closely with the 38.2% Fibonacci retracement.
Stop loss is at 195.60 which is a level that lies underneath a pullback support and the 61.8% Fibonacci retracement.
Take profit is at 198.60 which is a swing-high resistance.
High Risk Investment Warning
Trading Forex/CFDs on margin carries a high level of risk and may not be suitable for all investors. Leverage can work against you.
Stratos Markets Limited (tradu.com ):
CFDs are complex instruments and come with a high risk of losing money rapidly due to leverage. 63% of retail investor accounts lose money when trading CFDs with this provider. You should consider whether you understand how CFDs work and whether you can afford to take the high risk of losing your money.
Stratos Europe Ltd (tradu.com ):
CFDs are complex instruments and come with a high risk of losing money rapidly due to leverage. 63% of retail investor accounts lose money when trading CFDs with this provider. You should consider whether you understand how CFDs work and whether you can afford to take the high risk of losing your money.
Stratos Global LLC (tradu.com ):
Losses can exceed deposits.
Please be advised that the information presented on TradingView is provided to Tradu (‘Company’, ‘we’) by a third-party provider (‘TFA Global Pte Ltd’). Please be reminded that you are solely responsible for the trading decisions on your account. There is a very high degree of risk involved in trading. Any information and/or content is intended entirely for research, educational and informational purposes only and does not constitute investment or consultation advice or investment strategy. The information is not tailored to the investment needs of any specific person and therefore does not involve a consideration of any of the investment objectives, financial situation or needs of any viewer that may receive it. Kindly also note that past performance is not a reliable indicator of future results. Actual results may differ materially from those anticipated in forward-looking or past performance statements. We assume no liability as to the accuracy or completeness of any of the information and/or content provided herein and the Company cannot be held responsible for any omission, mistake nor for any loss or damage including without limitation to any loss of profit which may arise from reliance on any information supplied by TFA Global Pte Ltd.
The speaker(s) is neither an employee, agent nor representative of Tradu and is therefore acting independently. The opinions given are their own, constitute general market commentary, and do not constitute the opinion or advice of Tradu or any form of personal or investment advice. Tradu neither endorses nor guarantees offerings of third-party speakers, nor is Tradu responsible for the content, veracity or opinions of third-party speakers, presenters or participants.

Fundamental Market Analysis for June 30, 2025 USDJPYThe USD/JPY pair is attracting some sellers towards 143.85 during the Asian session on Monday. The U.S. dollar (USD) is weakening against the Japanese yen (JPY) amid rising bets for a Federal Reserve (Fed) interest rate cut.
The United States (US) and China are close to a deal on tariffs. However, U.S. President Donald Trump abruptly ended trade talks with Canada, adding uncertainty to the market's positive outlook.
In addition, traders are betting that the U.S. central bank will cut rates more frequently and possibly sooner than previously expected. Markets estimate the probability of a quarter-point Fed rate cut at nearly 92.4%, up from 70% a week earlier.
On the data side, the personal consumption expenditure (PCE) price index rose 2.3% in May, up from 2.2% in April (revised from 2.1%), the U.S. Bureau of Economic Analysis reported Friday. This value matched market expectations. Meanwhile, the core PCE price index, which excludes volatile food and energy prices, rose 2.7% in May, following a 2.6% increase (revised from 2.5%) seen in April.
On the other hand, the Bank of Japan's (BoJ) cautious stance on interest rate hikes could put pressure on the yen and create a tailwind for the pair.
Trade recommendation: SELL 143.50, SL 144.30, TP 142.40

AUD/JPY at Risk of Breakdown as Bullish Momentum FadesAUD/JPY failed to follow through on a bullish breakout above 94.00, despite initial signs of strength from a bullish hammer and inverted H&S pattern. The pair has since printed a bearish engulfing candle on the daily chart to take prices near the lows of its range of the past week.
With the 1-hour RSI (2) hitting oversold levels, a minor bounce is possible, but risks remain skewed to the downside. A break beneath 93.70 would confirm a range breakdown and open the door to a deeper pullback towards the high-volume node (HVN) at 93.85.
Matt Simpson, Market Analyst at City Index and Forex.com.

US$ Carry Trade BLOWUP IS SETTING UP The chart posted is the Yen/US$ I have NOT changed the labeling see forecast I feel something is about to Break in the markets ! best of trades WAVETIMER

SHORT ON GBP/JPYGJ has given us a CHOC (change of character) on the Lower timeframes breaking a strong low.
I will be selling GJ to the next demand level basically catching the pullback to its overall UPTREND.
looking to catch 200-300 pips this week.

GBP/JPY H1 | Rising into an overlap resistanceGBP/JPY is rising towards an overlap resistance and could potentially reverse off this level to drop lower.
Sell entry is at 194.86 which is an overlap resistance.
Stop loss is at 195.43 which is a level that sits above the 38.2% Fibonacci retracement and a multi-swing-high resistance.
Take profit is at 193.95 which is a swing-low support.
High Risk Investment Warning
Trading Forex/CFDs on margin carries a high level of risk and may not be suitable for all investors. Leverage can work against you.
Stratos Markets Limited (tradu.com ):
CFDs are complex instruments and come with a high risk of losing money rapidly due to leverage. 63% of retail investor accounts lose money when trading CFDs with this provider. You should consider whether you understand how CFDs work and whether you can afford to take the high risk of losing your money.
Stratos Europe Ltd (tradu.com ):
CFDs are complex instruments and come with a high risk of losing money rapidly due to leverage. 63% of retail investor accounts lose money when trading CFDs with this provider. You should consider whether you understand how CFDs work and whether you can afford to take the high risk of losing your money.
Stratos Global LLC (tradu.com ):
Losses can exceed deposits.
Please be advised that the information presented on TradingView is provided to Tradu (‘Company’, ‘we’) by a third-party provider (‘TFA Global Pte Ltd’). Please be reminded that you are solely responsible for the trading decisions on your account. There is a very high degree of risk involved in trading. Any information and/or content is intended entirely for research, educational and informational purposes only and does not constitute investment or consultation advice or investment strategy. The information is not tailored to the investment needs of any specific person and therefore does not involve a consideration of any of the investment objectives, financial situation or needs of any viewer that may receive it. Kindly also note that past performance is not a reliable indicator of future results. Actual results may differ materially from those anticipated in forward-looking or past performance statements. We assume no liability as to the accuracy or completeness of any of the information and/or content provided herein and the Company cannot be held responsible for any omission, mistake nor for any loss or damage including without limitation to any loss of profit which may arise from reliance on any information supplied by TFA Global Pte Ltd.
The speaker(s) is neither an employee, agent nor representative of Tradu and is therefore acting independently. The opinions given are their own, constitute general market commentary, and do not constitute the opinion or advice of Tradu or any form of personal or investment advice. Tradu neither endorses nor guarantees offerings of third-party speakers, nor is Tradu responsible for the content, veracity or opinions of third-party speakers, presenters or participants.

SHORT ON AUD/JPYAUD/JPY has given us a choc (change of character) from up to down at a major resistance zone.
I will be selling AUD/JPY to the next demand level looking to catch 100-200 pips

Yen Holds Ground as BoJ Stays CautiousThe yen held near 145.1 per dollar on Wednesday following three consecutive sessions of losses, weighed down by soft economic data and trade uncertainty. Japan’s exports declined in May for the first time in eight months, alongside drops in machinery orders and manufacturing sentiment. The Bank of Japan left rates unchanged and maintained a cautious tone, though Governor Ueda signaled future hikes remain possible. Trade talks between Prime Minister Ishiba and President Trump at the G7 summit showed no progress on tariffs.
Resistance is at 145.30, while support stands near 142.50.

EUR/JPY, GBP/JPY, CAD/JPY, CHF/JPY Price Action SetupsWith the conclusion of the FOMC meeting just hours away, I wanted to move away from the US dollar and look at some crosses. Here are some interesting setups on yen pairs to keep in mind.
Matt Simpson, Market Analyst at City Index and Forex.com

USD/JPY: Yen Continues to Lose Ground Against the U.S. DollarOver the past three trading sessions, USD/JPY has risen by more than 1%, favoring the U.S. dollar, as the yen continues to weaken steadily. The bullish bias has persisted, supported by a rebound in dollar strength. The DXY index, which measures the dollar's performance against other major currencies, has been climbing in the short term and is once again approaching the 100-point mark, signaling growing confidence in the dollar’s movements. If this dollar strength persists, buying pressure in USD/JPY may become increasingly dominant.
Consistent Downtrend
Since early January of this year, USD/JPY has been consolidating consistent downward movements, shaping a solid bearish trend that has lasted through recent months. Currently, price action is once again testing a resistance zone, aligned with the downtrend line, but buying momentum has not been strong enough to break through. As a result, the dominant trend remains bearish, unless a significant bullish breakout manages to disrupt the pattern.
Neutrality in Indicators
At the moment, the RSI line is oscillating near the 50 level, while the MACD histogram remains close to the zero line. These patterns suggest a state of equilibrium between buying and selling pressure, which has led to a series of neutral movements. As long as both indicators remain in this range, it reflects a lack of dominance by either market force in the short term.
Key Levels to Watch:
145.470 – Short-Term Barrier: A level where potential bearish corrections could emerge, especially as price remains near the downtrend line under conditions of neutrality.
148.012 – Major Resistance: This corresponds to the recent multi-month highs. Sustained buying above this level could threaten the prevailing bearish trend.
142.367 – Critical Support: A level aligned with the lowest prices of recent months, which has been repeatedly respected, increasing its strength in the short term. A breakdown here could trigger a renewed bearish bias, reinforcing the ongoing downward trend.
Written by Julian Pineda, CFA – Market Analyst
Follow him at: @julianpineda25

SHORT ON EUR/JPYEJ has created a (Rising Channel) with a (Double Top) at a major resistance zone.
Both Chart Patterns are Bearish Reversal Patterns.
I will be Selling EJ to the next demand level as it seeks out liquidity to the downside for 100-200 pips.
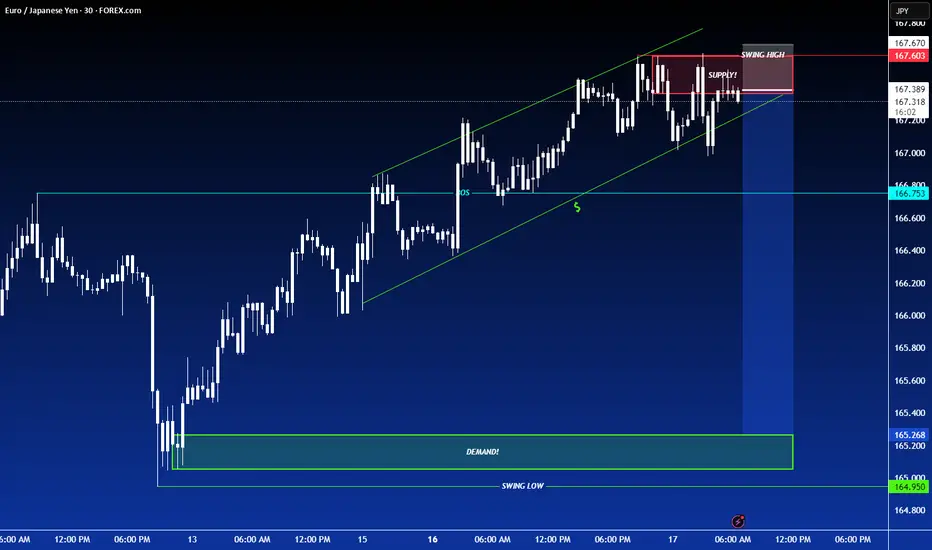
SELL EURJPYIn todays session we are monitoring EURJPY for selling opportunity. Our entry is at 167.302 our stop is above 168.000 and targets are below 165.200. Use proper risk management and remember the stop loss should be adjusted based on your risk management, sometimes it can be too tight or it can be extended depending on validity of a set up . Cheers to you all.
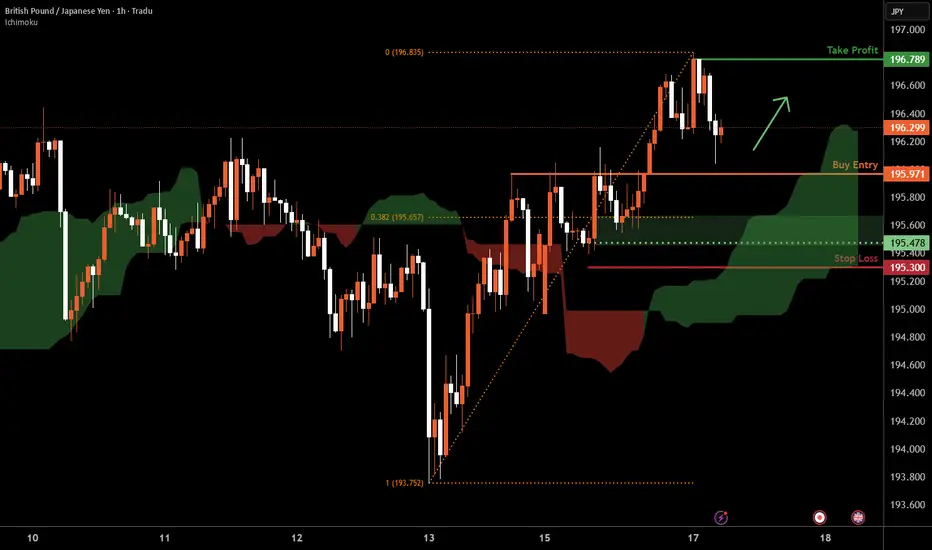
GBP/JPY H1 | Approaching a pullback supportGBP/JPY is falling towards a pullback support and could potentially bounce off this level to climb higher.
Buy entry is at 195.97 which is a pullback support.
Stop loss is at 195.30 which is a level that lies underneath a swing-low support and the 38.2% Fibonacci retracement.
Take profit is at 196.78 which is a swing-high resistance.
High Risk Investment Warning
Trading Forex/CFDs on margin carries a high level of risk and may not be suitable for all investors. Leverage can work against you.
Stratos Markets Limited (tradu.com ):
CFDs are complex instruments and come with a high risk of losing money rapidly due to leverage. 63% of retail investor accounts lose money when trading CFDs with this provider. You should consider whether you understand how CFDs work and whether you can afford to take the high risk of losing your money.
Stratos Europe Ltd (tradu.com ):
CFDs are complex instruments and come with a high risk of losing money rapidly due to leverage. 63% of retail investor accounts lose money when trading CFDs with this provider. You should consider whether you understand how CFDs work and whether you can afford to take the high risk of losing your money.
Stratos Global LLC (tradu.com ):
Losses can exceed deposits.
Please be advised that the information presented on TradingView is provided to Tradu (‘Company’, ‘we’) by a third-party provider (‘TFA Global Pte Ltd’). Please be reminded that you are solely responsible for the trading decisions on your account. There is a very high degree of risk involved in trading. Any information and/or content is intended entirely for research, educational and informational purposes only and does not constitute investment or consultation advice or investment strategy. The information is not tailored to the investment needs of any specific person and therefore does not involve a consideration of any of the investment objectives, financial situation or needs of any viewer that may receive it. Kindly also note that past performance is not a reliable indicator of future results. Actual results may differ materially from those anticipated in forward-looking or past performance statements. We assume no liability as to the accuracy or completeness of any of the information and/or content provided herein and the Company cannot be held responsible for any omission, mistake nor for any loss or damage including without limitation to any loss of profit which may arise from reliance on any information supplied by TFA Global Pte Ltd.
The speaker(s) is neither an employee, agent nor representative of Tradu and is therefore acting independently. The opinions given are their own, constitute general market commentary, and do not constitute the opinion or advice of Tradu or any form of personal or investment advice. Tradu neither endorses nor guarantees offerings of third-party speakers, nor is Tradu responsible for the content, veracity or opinions of third-party speakers, presenters or participants.
AUD/JPY Bulls Eye 95+ After Bullish ReversalAUD/JPY bounced sharply on Thursday, snapping a 3-day losing streak with a solid bullish-range session. The rally kicked off from a bullish pinbar above 92, where the higher low reinforces support and the broader bullish case.
The 1-hour chart shows a clean breakout from an inverted head and shoulders pattern, pointing to a target around 95.50. With resistance at the April high (95.30), March high (95.75), and the 96 handle, there’s still room for bulls to run.
Dips toward 94 may offer opportunities to join the trend — but a break back below the neckline would shift the tone back to risk-off.
Matt Simpson, Market Analyst at City Index and Forex.com

USDJPY – Triangle Complete? Wave (v) Setup BuildingWave (iv) appears to be ending with an (e) wave tag into the 0.764 retracement.
📉 Price remains capped within the contracting triangle — watching closely for breakdown confirmation.
If this plays out, wave (v) of C could now begin unfolding with initial focus on 140.00 and below.
🧩 Structure: (a)-(b)-(c)-(d)-(e) triangle complete
📏 Final wave (e) aligns with 0.764 retracement and structural resistance
⚠️ RSI divergence + weakening momentum support the bearish scenario

USDJPY 1W forecast until September 2025A huge inverted Head&Shoulders has been started. Volatility chop-chop. Left shoulder is ready and the price is heading up to the base at 145.188
In the middle of June we will see a fast fall to print Head bottoming at 138.75
Before printing Right shoulder the price has to visit the base again in the beginning of August 2025
What will happen in September? I will keep posting and updating (if I see necessity) 1W chart here. For 1D weekly updates check 'Also on' in my Profile.

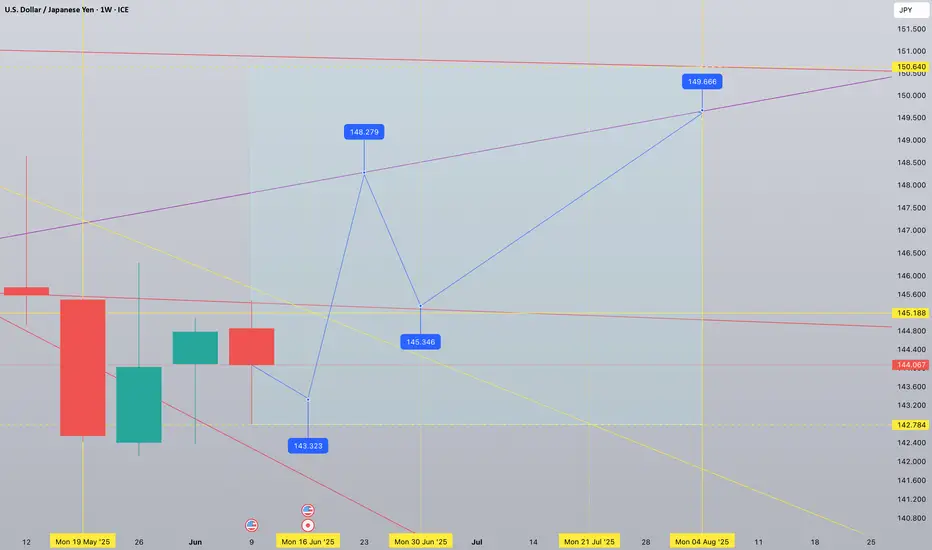
USDJPY 1W tf forecast until August 2025 Current midterm bias is bullish. 150,64 and 142,78 are extreme levels to be respected by the price action. One more week of red week of sideways movement will actually form a reversal pattern followed by a strong upward spike. A powerful breakout to 148,27 is to be retested at 145,34 - healthy retest. July will show an organic growth topping at 149.66 in the beginning of August 2025
Yen Rallies as Risk Aversion ReturnsThe Japanese yen strengthened to approximately 143 per dollar, marking a third consecutive day of gains as investors turned to safe-haven assets following Israel’s preemptive strike on Iran. The operation, aimed at nuclear facilities, heightened global risk aversion. Adding to market uncertainty were renewed U.S. tariff threats by Trump. Meanwhile, BoJ Governor Ueda reiterated the bank’s readiness to raise interest rates if inflation nears the 2% target.
Resistance is at 145.30, while support stands near 142.50.

CHFJPY I Technical & Fundamental Forecast Welcome back! Let me know your thoughts in the comments!
** CHFJPY Analysis - Listen to video!
We recommend that you keep this pair on your watchlist and enter when the entry criteria of your strategy is met.
Please support this idea with a LIKE and COMMENT if you find it useful and Click "Follow" on our profile if you'd like these trade ideas delivered straight to your email in the future.
Thanks for your continued support!Welcome back! Let me know your thoughts in the comments!

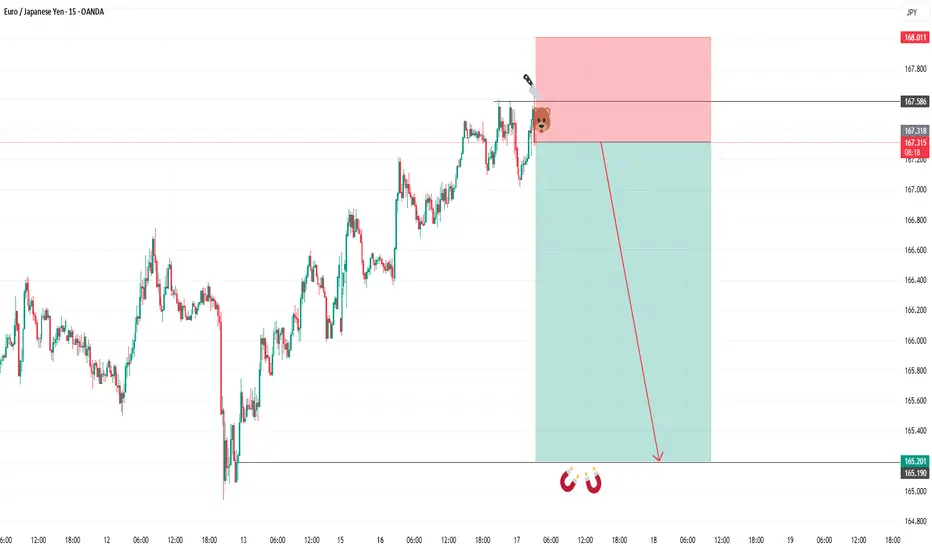
SHORT ON EUR/JPYOn the 1 min Timeframe EJ has given us a choc (change of character) to the downside with a nice break and retest to a major supply area.
The JPY index is bullish which should cause EJ to fall.
I will be selling EJ to the next level of demand looking to catch 100-200 pips.

Fundamental Market Analysis for June 12, 2025 USDJPYThe Japanese Yen (JPY) is strengthening for the second day in a row against a weakened US Dollar (USD) and is moving further away from the two-week low reached the day before. The market's initial reaction to news of trade talks between the US and China faded rather quickly after US President Donald Trump threatened new tariffs. This, along with rising geopolitical tensions, curbs investors' appetite for risky assets and maintains the yen's status as a safe-haven currency.
In addition, the yen is further supported by expectations that the Bank of Japan (BoJ) may tighten monetary conditions amid signs of rising inflation in Japan. On the other hand, the US Dollar looks vulnerable near one-month lows as weaker US consumer inflation data released on Wednesday confirmed expectations that the Federal Reserve (Fed) will resume its rate-cutting cycle in September. This, in turn, led the USD/JPY pair to fall below 143.50 in the last hour.
Trade recommendation: SELL 143.30, SL 144.30, TP 141.30

USD/JPY H1 | Bearish downtrend to extend deeper?USD/JPY is rising towards a pullback resistance and could potentially reverse off this level to drop lower.
Sell entry is at 144.10 which is a pullback resistance that aligns with the 23.6% Fibonacci retracement.
Stop loss is at 144.80 which is a level that sits above the 61.8% Fibonacci retracement and an overlap resistance.
Take profit is at 143.37 which is a pullback support.
High Risk Investment Warning
Trading Forex/CFDs on margin carries a high level of risk and may not be suitable for all investors. Leverage can work against you.
Stratos Markets Limited (tradu.com ):
CFDs are complex instruments and come with a high risk of losing money rapidly due to leverage. 63% of retail investor accounts lose money when trading CFDs with this provider. You should consider whether you understand how CFDs work and whether you can afford to take the high risk of losing your money.
Stratos Europe Ltd (tradu.com ):
CFDs are complex instruments and come with a high risk of losing money rapidly due to leverage. 63% of retail investor accounts lose money when trading CFDs with this provider. You should consider whether you understand how CFDs work and whether you can afford to take the high risk of losing your money.
Stratos Global LLC (tradu.com ):
Losses can exceed deposits.
Please be advised that the information presented on TradingView is provided to Tradu (‘Company’, ‘we’) by a third-party provider (‘TFA Global Pte Ltd’). Please be reminded that you are solely responsible for the trading decisions on your account. There is a very high degree of risk involved in trading. Any information and/or content is intended entirely for research, educational and informational purposes only and does not constitute investment or consultation advice or investment strategy. The information is not tailored to the investment needs of any specific person and therefore does not involve a consideration of any of the investment objectives, financial situation or needs of any viewer that may receive it. Kindly also note that past performance is not a reliable indicator of future results. Actual results may differ materially from those anticipated in forward-looking or past performance statements. We assume no liability as to the accuracy or completeness of any of the information and/or content provided herein and the Company cannot be held responsible for any omission, mistake nor for any loss or damage including without limitation to any loss of profit which may arise from reliance on any information supplied by TFA Global Pte Ltd.
The speaker(s) is neither an employee, agent nor representative of Tradu and is therefore acting independently. The opinions given are their own, constitute general market commentary, and do not constitute the opinion or advice of Tradu or any form of personal or investment advice. Tradu neither endorses nor guarantees offerings of third-party speakers, nor is Tradu responsible for the content, veracity or opinions of third-party speakers, presenters or participants.
