NZDJPY - One More Bullish Leg!Hello TradingView Family / Fellow Traders. This is Richard, also known as theSignalyst.
📈NZDJPY has been overall bullish trading within the rising wedge marked in blue.
Moreover, the green zone is a strong support!
🏹 Thus, the highlighted blue circle is a strong area to look for buy setups as it is the intersection of support and lower blue trendline acting as a non-horizontal support.
📚 As per my trading style:
As #NZDJPY approaches the blue circle zone, I will be looking for bullish reversal setups (like a double bottom pattern, trendline break , and so on...)
📚 Always follow your trading plan regarding entry, risk management, and trade management.
Good luck!
All Strategies Are Good; If Managed Properly!
~Rich
Disclosure: I am part of Trade Nation's Influencer program and receive a monthly fee for using their TradingView charts in my analysis.
Yen

Fundamental Market Analysis for June 9, 2025 USDJPYThe Japanese Yen (JPY) is rising at the start of the new week, reacting to upward revisions to Japan's first quarter GDP data. This comes amid signs of rising inflation in Japan and confirmation of bets that the Bank of Japan (BoJ) will continue to raise interest rates, which in turn provides a slight boost to the JPY. In addition, a modest decline in the US Dollar (USD) is putting some downward pressure on the USD/JPY pair during the Asian session.
For now, the Yen appears to have broken a two-day losing streak against its US counterpart, although traders may refrain from aggressive directional bets ahead of key US-China trade talks in London. In addition, stronger-than-expected US jobs data released on Friday dampened hopes that the Federal Reserve (Fed) will cut interest rates soon this year, which could serve as a tailwind for the dollar and limit USD/JPY pair losses.
Trade recommendation: SELL 143.85, SL 144.85, TP 141.85

Japan : Q1 2025 GDP Revision: Milder ContractionFinal data for Q1 2025 shows that Japan's economy contracted by 0.2% year-on-year (YoY), better than the initial estimate of -0.7%
(Sources: english.kyodonews.net, reuters.com, fxstreet.com).
Growth in household consumption and an increase in inventory levels were the main drivers, although the export sector remained a drag due to U.S. tariff pressures.
On a quarterly basis (QoQ), the economy recorded flat growth (0.0%), exceeding expectations of a -0.2% contraction
(Sources: reuters.com, fxstreet.com).
In summary: The revision shows that Japan’s economy is not as weak as initially feared, though it still reflects underlying sluggish conditions.

USD/JPY H1 | Overlap Resistance at 78.6% Fibonacci RetracementUSD/JPY is rising towards an overlap resistance and could potentially reverse off this level to drop lower.
Sell entry is at 143.88 which is an overlap resistance that aligns close to the 78.6% Fibonacci retracement.
Stop loss is at 144.55 which is a level that sits above the 50.0% Fibonacci retracement and a multi-swing-high resistance.
Take profit is at 143.02 which is a swing-low support.
High Risk Investment Warning
Trading Forex/CFDs on margin carries a high level of risk and may not be suitable for all investors. Leverage can work against you.
Stratos Markets Limited (tradu.com ):
CFDs are complex instruments and come with a high risk of losing money rapidly due to leverage. 63% of retail investor accounts lose money when trading CFDs with this provider. You should consider whether you understand how CFDs work and whether you can afford to take the high risk of losing your money.
Stratos Europe Ltd (tradu.com ):
CFDs are complex instruments and come with a high risk of losing money rapidly due to leverage. 63% of retail investor accounts lose money when trading CFDs with this provider. You should consider whether you understand how CFDs work and whether you can afford to take the high risk of losing your money.
Stratos Global LLC (tradu.com ):
Losses can exceed deposits.
Please be advised that the information presented on TradingView is provided to Tradu (‘Company’, ‘we’) by a third-party provider (‘TFA Global Pte Ltd’). Please be reminded that you are solely responsible for the trading decisions on your account. There is a very high degree of risk involved in trading. Any information and/or content is intended entirely for research, educational and informational purposes only and does not constitute investment or consultation advice or investment strategy. The information is not tailored to the investment needs of any specific person and therefore does not involve a consideration of any of the investment objectives, financial situation or needs of any viewer that may receive it. Kindly also note that past performance is not a reliable indicator of future results. Actual results may differ materially from those anticipated in forward-looking or past performance statements. We assume no liability as to the accuracy or completeness of any of the information and/or content provided herein and the Company cannot be held responsible for any omission, mistake nor for any loss or damage including without limitation to any loss of profit which may arise from reliance on any information supplied by TFA Global Pte Ltd.
The speaker(s) is neither an employee, agent nor representative of Tradu and is therefore acting independently. The opinions given are their own, constitute general market commentary, and do not constitute the opinion or advice of Tradu or any form of personal or investment advice. Tradu neither endorses nor guarantees offerings of third-party speakers, nor is Tradu responsible for the content, veracity or opinions of third-party speakers, presenters or participants.

Japanese Yen to Da Moon!I compared the yen to every single currency pair and USDJPY is the most volatile. BOJ will raise interest rates to 0.75%-1% by late 2025/early 2026. And IF the FED chooses to lower rates that will further exacerbate Yen strength.
103.156 TP, but TBH I see price breaking well past that point and yen will make new all time highs. The dollar will get desecrated across all currencies, the yen will destroy it the hardest. Most likely BTC will also peak around this same time period and youll see and end to the bull cycle and we will enter BTC bear cycle but that is beside the point.
Potential Black Swan Event: the US enters into a recessionary environment, while I dont think this is likely bc everyone is saying that, it will be possible if we see a further escalation in the Ukraine conflict or if the US chooses to enter war with Iran. War is the only situation I see potential US recession.
I predicted then yen would get dusted during COVID, now I predict yen will make never seen before gains for the next 5 years minimum. Let's see how this plays out.

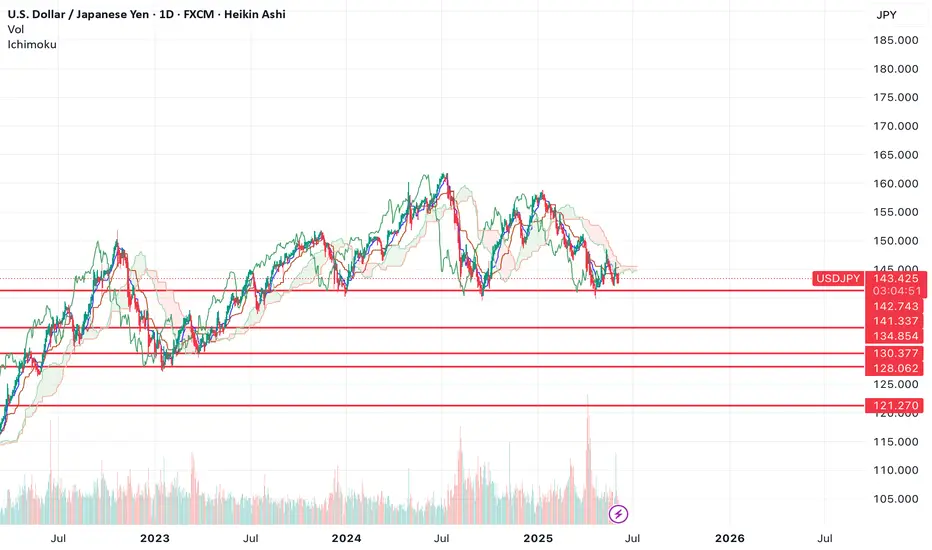
The Yen the cause of the next decline?The yen strengthening is what preceded the last market selloff and it looks like it could also be the cause of the next one.
If we look at the chart, it seems like we've now formed a massive top.
If USDJPY breaks through support at 141.33 that should be the initial trigger for a short. Below $139, under the wicks would be the safer play.
I could see the move going all the way down to the lower support levels.
Let's see how it plays out.
LONG ON GBP/JPYGJ has given us a double bottom at a major demand level.
I am looking to catch over 100 pips on GJ to the previous high.

GBPJPY LONG FORECAST Q2 W23 D3 Y25GBPJPY LONG FORECAST Q2 W23 D3 Y25
Professional Risk Managers👋
Welcome back to another FRGNT chart update📈
Diving into some Forex setups using predominantly higher time frame order blocks alongside confirmation breaks of structure.
Let’s see what price action is telling us today!
💡Here are some trade confluences📝
✅Daily order block
✅15' order block
✅Intraday breaks of structure
✅4H 50 EMA rejection
🔑 Remember, to participate in trading comes always with a degree of risk, therefore as professional risk managers it remains vital that we stick to our risk management plan as well as our trading strategies.
📈The rest, we leave to the balance of probabilities.
💡Fail to plan. Plan to fail.
🏆It has always been that simple.
❤️Good luck with your trading journey, I shall see you at the very top.
🎯Trade consistent, FRGNT X

YEN/$USA topped in the target 144/146 and now supported into fibThe chart posted is the USA $/YEN chart it is key to all things as to the sp 500 and debt markets A few weeks back I posted The chart of a MASSIVE HEAD N SHOULDER TOP formation !!! we are still forming the Right shoulder in a rather complex wave STRUCTURE This is the hourly model and forecast so far spot on . best of trades WAVETIMER

LONG ON USD/JPYUJ has given a choc (change or character) at a major demand zone.
JPY index structure is currently bearish.
I will buying UJ to the next swing high looking to catch 100-200 pips

Yen Strengthens Beyond 144 on InflationThe Japanese yen rose past 144 per dollar, extending gains after Tokyo’s core inflation beat expectations, increasing the likelihood of a 25 bps BOJ rate hike in July.
BOJ Governor Kazuo Ueda said recent forecast adjustments were due to global risks and lower oil prices but reaffirmed the short-term policy stance remains focused on the 2% inflation goal. The yen also gained from safe-haven flows after a U.S. court reinstated Trump’s reciprocal tariffs.
Resistance is at 144.50, with further resistance at 145.40 and 146.10. Support levels stand at 143.50, 143.00, and 142.10.

Yen Stabilizes as Risk Sentiment ImprovesThe Japanese Yen edged up from a two-week low on Thursday but lacked strong momentum, as risk appetite improved after a U.S. court blocked Trump’s “Liberation Day” tariffs, reducing demand for safe havens. Concerns over Japan’s rising debt continue to pressure the Yen. Meanwhile, USD/JPY rose for a fourth day, supported by hawkish FOMC minutes, though markets still expect a Fed rate cut. Expectations of a more hawkish Bank of Japan helped limit the Yen’s losses.
The key resistance is at $147.10 meanwhile the major support is located at $145.00.

USD/JPY H4 | Overhead pressures remain?USD/JPY is rising towards a pullback resistance and could potentially reverse off this level to drop lower.
Sell entry is at 143.27 which is a pullback resistance that aligns with the 50.0% Fibonacci retracement.
Stop loss is at 144.42 which is a level that sits above the 23.6% and 78.6% Fibonacci retracements and a swing-high resistance.
Take profit is at 141.96 which is a multi-swing-low support.
High Risk Investment Warning
Trading Forex/CFDs on margin carries a high level of risk and may not be suitable for all investors. Leverage can work against you.
Stratos Markets Limited (tradu.com ):
CFDs are complex instruments and come with a high risk of losing money rapidly due to leverage. 63% of retail investor accounts lose money when trading CFDs with this provider. You should consider whether you understand how CFDs work and whether you can afford to take the high risk of losing your money.
Stratos Europe Ltd (tradu.com ):
CFDs are complex instruments and come with a high risk of losing money rapidly due to leverage. 63% of retail investor accounts lose money when trading CFDs with this provider. You should consider whether you understand how CFDs work and whether you can afford to take the high risk of losing your money.
Stratos Global LLC (tradu.com ):
Losses can exceed deposits.
Please be advised that the information presented on TradingView is provided to Tradu (‘Company’, ‘we’) by a third-party provider (‘TFA Global Pte Ltd’). Please be reminded that you are solely responsible for the trading decisions on your account. There is a very high degree of risk involved in trading. Any information and/or content is intended entirely for research, educational and informational purposes only and does not constitute investment or consultation advice or investment strategy. The information is not tailored to the investment needs of any specific person and therefore does not involve a consideration of any of the investment objectives, financial situation or needs of any viewer that may receive it. Kindly also note that past performance is not a reliable indicator of future results. Actual results may differ materially from those anticipated in forward-looking or past performance statements. We assume no liability as to the accuracy or completeness of any of the information and/or content provided herein and the Company cannot be held responsible for any omission, mistake nor for any loss or damage including without limitation to any loss of profit which may arise from reliance on any information supplied by TFA Global Pte Ltd.
The speaker(s) is neither an employee, agent nor representative of Tradu and is therefore acting independently. The opinions given are their own, constitute general market commentary, and do not constitute the opinion or advice of Tradu or any form of personal or investment advice. Tradu neither endorses nor guarantees offerings of third-party speakers, nor is Tradu responsible for the content, veracity or opinions of third-party speakers, presenters or participants.

YEN BOTTOMING Look for ABC up back to 144/145The us $ yen trade should now be setup to rally But I can allow one more minor low into,786 But we should begin the final rally up into June 9 to the 16th for support in the carry trade and in SP500 into a seasonal cycle peak . As I have posted the long term chart of a massive Head n shoulder TOP in yen trade . Best of trades WAVETIMER

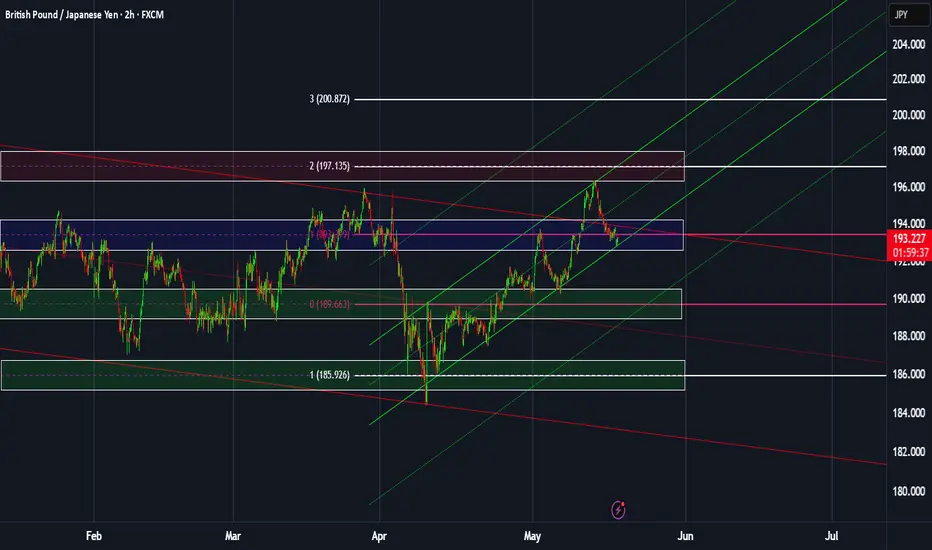
GBPJPY: Weekly overview + Significant zonesHello dear traders,
The indicated levels are determined based on the most reaction points and the assumption of approximately equal distance between the zones.
These points can also be confirmed by the mathematical intervals of Murray.
After reacting to the following zones, you can enter the trade. Place the stop loss slightly above/below the zone to which the reaction was shown. The profit point is the next zone.
The drawn channels and their medians can also be considered as moving support and resistance. I usually use them as target points. I've doubled the short-term channel because it was so thin ;-).
* I don't use 189.663 zone to take short! There are too many moving S&R around it.
This analysis is valid until the end of the week.
**************************************
Important news that could change the direction of the trade:
Wed: Great Britain CPI of April.
Yen Strengthens on Dollar WeaknessThe Japanese yen firmed to around 143.6 per dollar, heading for a weekly gain of over 1% as inflation data came in stronger than expected. Core inflation surged to 3.5%, its highest in more than two years, while headline inflation held at 3.6%, reinforcing expectations that the BoJ may maintain its tightening stance.
The yen also benefited from continued dollar weakness tied to U.S. fiscal worries. Earlier, Japan’s Finance Minister Katsunobu Kato denied discussing exchange rates with U.S. Treasury Secretary Bessent at the G7 summit, dismissing rumors of joint currency intervention.
USD/JPY faces resistance at 148.60, with further upside levels at 149.80 and 151.20. Key support lies at 139.70, then 137.00 and 135.00.

GBP/JPY Holds Key Support as Bullish Momentum BuildsA bullish setup has emerged on GBP/JPY, with recent price action suggesting bullish momentum is building. With GBP strengthening against USD, GBP/JPY may present a higher-probability bullish scenario compared to USD/JPY in the near term (though this also looks bullish to my eyes over the near term).
GBP/JPY held above key moving averages midweek. GBP/JPY failed to close below its 200-day SMA on both Wednesday and Thursday, while yesterday’s session also respected support at the 50-day EMA and the 192.00 handle.
Momentum indicators support the bullish case, with the daily RSI trading above 50 after rebounding from its most oversold level in six weeks.
As long as prices hold above Thursday’s low, bulls may look for a retest of the cycle highs near 196.00.
** Please note that Japan's CPI data drops in >30 minutes **
Matt Simpson, Market Analyst at City Index and Forex.com

JPY Hits 2-Week High as Dollar WeakensThe Japanese yen strengthened to around 143 per dollar on Thursday, its highest in over two weeks, as concerns over the U.S. fiscal outlook pressured the dollar. Fears that Trump’s proposed tax cuts could add over $3 trillion to U.S. debt weighed on investor confidence.
Japan’s Finance Minister Kato said he did not discuss currency levels with Treasury Secretary Bessent at the G7 summit.
Domestically, core machinery orders surged 13% in March, beating expectations of a 1.6% drop, while May PMI data showed continued weakness in both manufacturing and services.

USD/JPY H1 | Bearish downtrend to extend further?USD/JPY is rising towards an overlap resistance and could potentially reverse off this level to drop lower.
Sell entry is at 143.50 which is an overlap resistance.
Stop loss is at 144.50 which is a level that sits above the 23.6% Fibonacci retracement and a swing-high resistance.
Take profit is at 142.35 which is a swing-low support.
High Risk Investment Warning
Trading Forex/CFDs on margin carries a high level of risk and may not be suitable for all investors. Leverage can work against you.
Stratos Markets Limited (tradu.com ):
CFDs are complex instruments and come with a high risk of losing money rapidly due to leverage. 63% of retail investor accounts lose money when trading CFDs with this provider. You should consider whether you understand how CFDs work and whether you can afford to take the high risk of losing your money.
Stratos Europe Ltd (tradu.com ):
CFDs are complex instruments and come with a high risk of losing money rapidly due to leverage. 63% of retail investor accounts lose money when trading CFDs with this provider. You should consider whether you understand how CFDs work and whether you can afford to take the high risk of losing your money.
Stratos Global LLC (tradu.com ):
Losses can exceed deposits.
Please be advised that the information presented on TradingView is provided to Tradu (‘Company’, ‘we’) by a third-party provider (‘TFA Global Pte Ltd’). Please be reminded that you are solely responsible for the trading decisions on your account. There is a very high degree of risk involved in trading. Any information and/or content is intended entirely for research, educational and informational purposes only and does not constitute investment or consultation advice or investment strategy. The information is not tailored to the investment needs of any specific person and therefore does not involve a consideration of any of the investment objectives, financial situation or needs of any viewer that may receive it. Kindly also note that past performance is not a reliable indicator of future results. Actual results may differ materially from those anticipated in forward-looking or past performance statements. We assume no liability as to the accuracy or completeness of any of the information and/or content provided herein and the Company cannot be held responsible for any omission, mistake nor for any loss or damage including without limitation to any loss of profit which may arise from reliance on any information supplied by TFA Global Pte Ltd.
The speaker(s) is neither an employee, agent nor representative of Tradu and is therefore acting independently. The opinions given are their own, constitute general market commentary, and do not constitute the opinion or advice of Tradu or any form of personal or investment advice. Tradu neither endorses nor guarantees offerings of third-party speakers, nor is Tradu responsible for the content, veracity or opinions of third-party speakers, presenters or participants.

USDJPY - Trendline Support to Determine Next Big MoveThe USD/JPY pair has been trading within a well-defined upward trajectory, currently testing key levels around 145.68. The diagonal trendline visible on the chart serves as a critical support level that has consistently propelled the pair higher since mid-April. Should the price respect this trendline in the coming sessions, we could see a temporary pullback before potentially rallying toward the resistance zone around 148.50, highlighted by the upper purple rectangle. However, traders should closely monitor any breaks below this trendline as it would signal a significant shift in momentum and possibly indicate a deeper correction. The pair appears to be consolidating after the recent pullback from May highs, with the trendline interaction likely determining the next directional move.
Disclosure: I am part of Trade Nation's Influencer program and receive a monthly fee for using their TradingView charts in my analysis.

GBPJPY - Bullish No More!Hello TradingView Family / Fellow Traders. This is Richard, also known as theSignalyst.
📈As per our last GBPJPY analysis (attached on the chart), it rejected the lower bound of the rising blue channel.
What's next?
GBPJPY is currently approaching the upper bound of its falling trend marked in red.
Moreover, the green zone is a strong structure and resistance.
🏹 Thus, the highlighted red circle is a strong area to look for sell setups as it is the intersection of structure and upper red trendline acting as a non-horizontal resistance.
📚 As per my trading style:
As #GBPJPY approaches the red circle zone, I will be looking for bearish reversal setups (like a double top pattern, trendline break , and so on...)
📚 Always follow your trading plan regarding entry, risk management, and trade management.
Good luck!
All Strategies Are Good; If Managed Properly!
~Rich
Disclosure: I am part of Trade Nation's Influencer program and receive a monthly fee for using their TradingView charts in my analysis.

Yen Strengthens Despite Japan’s Q1 ContractionThe Japanese yen strengthened toward 145 per dollar, extending its rally for a fourth straight day, despite Japan’s economy shrinking by 0.2% in the first quarter, worse than forecasts. While the Bank of Japan acknowledged the risks posed by U.S. trade policies, it remains confident that rising wages and prices will support eventual policy normalization. Investors are closely watching U.S.-Japan trade negotiations, with Japan insisting that any deal must include the auto sector and that the 25% U.S. tariff on Japanese cars be removed.
Resistance is noted at 148.60, with further barriers at 149.80 and 151.20. Major support levels lie at 139.70, 137.00, and 135.00.

USD/JPY H4 | Overlap resistance at 23.6% Fibonacci retracementUSD/JPY is rising towards an overlap resistance and could potentially reverse off this level to drop lower.
Sell entry is at 145.82 which is an overlap resistance that aligns with the 23.6% Fibonacci retracement.
Stop loss is at 147.11 which is a level that sits above the 50.0% Fibonacci retracement and a swing-high resistance.
Take profit is at 144.16 which is a pullback support that aligns with the 50.0% Fibonacci retracement.
High Risk Investment Warning
Trading Forex/CFDs on margin carries a high level of risk and may not be suitable for all investors. Leverage can work against you.
Stratos Markets Limited (tradu.com):
CFDs are complex instruments and come with a high risk of losing money rapidly due to leverage. 63% of retail investor accounts lose money when trading CFDs with this provider. You should consider whether you understand how CFDs work and whether you can afford to take the high risk of losing your money.
Stratos Europe Ltd (tradu.com):
CFDs are complex instruments and come with a high risk of losing money rapidly due to leverage. 63% of retail investor accounts lose money when trading CFDs with this provider. You should consider whether you understand how CFDs work and whether you can afford to take the high risk of losing your money.
Stratos Global LLC (tradu.com):
Losses can exceed deposits.
Please be advised that the information presented on TradingView is provided to Tradu (‘Company’, ‘we’) by a third-party provider (‘TFA Global Pte Ltd’). Please be reminded that you are solely responsible for the trading decisions on your account. There is a very high degree of risk involved in trading. Any information and/or content is intended entirely for research, educational and informational purposes only and does not constitute investment or consultation advice or investment strategy. The information is not tailored to the investment needs of any specific person and therefore does not involve a consideration of any of the investment objectives, financial situation or needs of any viewer that may receive it. Kindly also note that past performance is not a reliable indicator of future results. Actual results may differ materially from those anticipated in forward-looking or past performance statements. We assume no liability as to the accuracy or completeness of any of the information and/or content provided herein and the Company cannot be held responsible for any omission, mistake nor for any loss or damage including without limitation to any loss of profit which may arise from reliance on any information supplied by TFA Global Pte Ltd.
The speaker(s) is neither an employee, agent nor representative of Tradu and is therefore acting independently. The opinions given are their own, constitute general market commentary, and do not constitute the opinion or advice of Tradu or any form of personal or investment advice. Tradu neither endorses nor guarantees offerings of third-party speakers, nor is Tradu responsible for the content, veracity or opinions of third-party speakers, presenters or participants.
