YFIUSDT 1W AnalysisYFI ~ 1W Analysis
#YFI This is the lowest support block for now. Buy gradually from here with a short term target of at least 20%+ from this support.
YFIUSDT

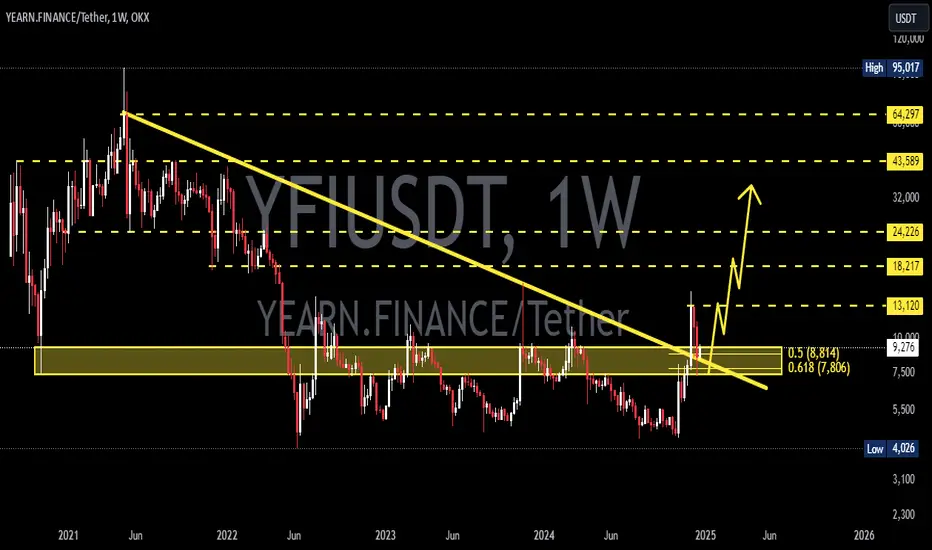
Yearn-Finance: Your Altcoin Choice (S2)I will start with the long-term linear chart and then move to the main chart above. This is a theme that I've been repeating across multiple charts trying to show that the market is trading at bottom prices.
The linear chart also shows clearly where a pair stands, in this case, trading at bottom prices.
I am trying to show, based on facts and market data, that the Altcoins market is not really in a bad bull market but rather in a neutral, long-term sideways period from where a bull market can start.
After a bull market comes a bear market, after the bear market we have a transition period which is the sideways market. Then a new bull market can start.
This is YIFUSDT (Yearn-Finance) long-term:
Of course there are ups and downs, swings, within this sideways period but this nothing compared to bull market action. In a bull market, we will have straight up, long-term higher highs and higher lows; maximum growth accompanied with huge bullish momentum and new All-Time Highs.
When the candles become almost invisible and flat, it means the market is neutral and sideways, the transition phase. From this a new bull market can develop and that's exactly what will happen. 2025/26. We are early, it will be great.
» Yearn-Finance
Just now, 7-April 2025, YFIUSDT produced a long-term double-bottom, hitting the lowest price level since June 2022, a major development.
— June 2022 marked the bear market bottom.
— April 2025 is likely to mark the end of the transition phase, the last low before the next major bull market.
The only possible way to describe what is happening now is only as an amazing opportunity, something not seen before for this pair and something seen only once every four years within the Cryptocurrency space.
That's it. We are in the buy-zone, accumulation zone, long-term support; time to buy we are set to grow long-term.
Growth potential is huge and tremendous and this is valid for all Cryptos, most of them. This is a generalization of course, each chart/pair needs to be considered individually because not everything will grow.
YFI has been around for a long while but bullish only for six months, between November 2020 and May 2021.
Here is one piece of evidence why I think this bull market will go beyond 2025, possibly.
By May 2021, YFIUSDT peaked, All-Time High and started a major bear market. Four years later, YFIUSDT is trading at bottom prices. A bull market cannot end in 30 days, a single month, since this pair is trading at bottom prices, it means it will grow for months and months to come. If it repeats the same pattern as in 2021, that would be at least 190 days going up. Last time it grew more than 1,150%. This time it can be anything, but prices are much lower today compared to the start of the previous bullish phase.
If strong bullish action starts in May, six months growing would put a new All-Time High in November 2025. If there are two waves rather than one, it can go beyond 2025 until 2026.
This pair can easily produce 10-11X, but there can be more.
If the bu-action goes into 2026, we can easily get 20-30X. If the action stops in late 2025, the potential can be capped at 11X. These are just projections, the market tend to surprise and always go beyond all expectations. The end result can be much different to anything we project or expect.
Prepare to be surprised.
The best is yet to come.
Namaste.

YFIUSDT 1WYFI ~ 1W Analysis
#YFI Buy gradually from here with a short -term target of at least 20%+. This is a strong support for now.

YFIUSDT 1WYFI ~ 1W Analysis
#YFI This is the lowest support for now. Buy from here if you still have a Conviction on this coin with a minimum target of 20%+

YFIUSDT 1WYFI Update ~ 1W
#YFI So far it is still maintaining its Bullish structure. and the current price successfully retested this rupport line + this Golden ratio. Buy gradually from here with a target of at least 20%+ from here.
yfiTo reach the upper lines and break this green box, it must break the two red boxes. Check for buys at the blue dots.

YFIUSDT Falling Wedge Breakou!YFIUSDT technical analysis update
YFI's price is breaking out of a falling wedge pattern after 325 days of formation. On the weekly chart, the price is bouncing from major bottom support, which can be considered bullish for YFI
Regards
Hexa

Look up!True story there's not enough YFI for everyone and it hit 90k before BTC just saying.. 🤷♂️
"You know yfi and btc have different supply/market cap scenarios right???"
"Ya, but... but.. but.." BOOM
Yahh ummm Number still go up bra! it don't matter to the memeholics so then why should I care ya know?
Soooo little time with sooo little coin. You tell me if that matters! Every Bitcoin Maxii from here to to the moon blabs about it none stop! "Olny 21Mil Only 21Mil! BTC Digital Gold!
Oh ya?? So tell me Circulating supply 33.60K YFI whats that make YFI then?
"One coin to rule them all until there is wait two or three... Oh wait there's another one!!!"
YOLO Moonboyz 🌛 If you feel so inclined to do so.
🚽👄Toilet Mouth: "Why do all your post say Short!?" or a bunch of "BUT, BUT, BUT"
⭐Not my job to tell you to buy or sell entries matter to most I only care about my exits.
⭐Let each person determine their cost to acquire and choice to play or not.
No Advice to give just thoughts that I can't shake after the last 8 years in the world of "CRYPTO"
Things 🤷♂️ #Fixed IDK!
🙏 FOR JUST A HEALTHLY PULLBACK!
""KEEP CALM AND MANAGE THY RISK & BALANCE your Senses!""
I am The CoinSLayer 👨💻😈
You have been warned by The Coin SLayer!
P.S. Now witha bag!
P.S.S. well two or Ten

Yearn. Finance ( YFI)YFI usdt Daily analysis
Time frame daily
Risk rewards ratio >2.5 👈👌
Target 11515 $

YFI Skyrockets to Massive 900% Gains with RisologicalYearn Finance (YFIUSDT) delivered remarkable profits on the 4-hour timeframe, leveraging the precision of the Risological swing trading indicator. The trade capitalized on a strong bullish momentum, hitting all defined targets with ease.
Key Levels:
TP1: 5117 ✅
TP2: 5587 ✅
TP3: 6057 ✅
TP4: 6348 ✅
Technical Analysis:
The trade initiated at an entry price of 4827, confirmed by strong bullish cues from the Risological trend line. These indicators consistently highlighted upward momentum, guiding the trade through multiple profit-taking levels.
The stop-loss, placed at 4592, provided a secure cushion against potential reversals, although the bullish trajectory remained uninterrupted. YFI demonstrated a steady ascent, achieving all targets within the anticipated time frame.
This setup underscored the efficacy of the Risological swing trading indicator in capturing and maximizing profits during a trending market.

YFIUSD - Incredible Alt SeasonBased on the last bull run I expect YFI to out perform BTC and price to move Higher than anything BTC can attain.
The up move might look very aggressive (it does) But I do expect huge gains on this alt
Daily timeframe
1M ??? Or am I losing it

YFIUSDT Forms Triple Bottom and Falling WedgeYFIUSDT technical analysis update
YFI has formed a falling wedge pattern, and the price is currently trading at its major support level, suggesting a potential bounce from the current range. A bullish move can be confirmed once the price breaks out of the falling wedge pattern. Additionally, YFI has formed a triple bottom and has been trading within the same range for the last 840 days. The price has bounced multiple times from this support, and we can expect a strong bullish bounce from this level once again.
Regards
Hexa

YFIUSDTYFI ~ 1W
#YFI 1It is at its lowest price currently. if you still have Conviction on this coin. this should be a very good price to start buying again.

YFIUSDTYFI ~ 1W ✅
#YFI Make purchases gradually on this support block. with a minimum target of 20%+ 🟡

YFIUSDT.4HAs I meticulously analyze the YFI/USDT 4-hour chart, I observe several key details and technical indicators that inform my trading strategy.
Current Market Position:
The YFI/USDT price stands at $6,064, showing a slight decrease of 0.28% in recent trading. The market is currently situated near the middle of the defined support and resistance levels, providing a mixed outlook.
Trend Analysis:
The price movement over the last few weeks shows a pattern of consolidation between key support and resistance levels. This consolidation suggests that the market is in a phase of indecision, with traders and investors gauging direction from upcoming market cues.
Support and Resistance Levels:
S1 at $5,259 and S2 at $5,825: These levels represent significant support zones. A drop towards these levels could indicate a buying opportunity, especially if the price shows signs of stabilization or bullish reversal signals near these points.
R1 at $6,392 and R2 at $7,009: These are the resistance levels to watch. A breakout above R1 could signal a bullish trend, with R2 as the next target for taking profits.
Technical Indicators:
Relative Strength Index (RSI): The RSI is at 58.94, slightly above the neutral 50 mark, indicating a mild bullish sentiment in the short term. This level suggests some upward potential but also warrants caution as it approaches overbought conditions.
Moving Average Convergence Divergence (MACD): The MACD line is above the signal line, which supports the bullish sentiment shown by the RSI. However, the closeness of the two lines suggests that the momentum is not strongly bullish, indicating possible fluctuations or a reversal if bearish pressure increases.
Volume Analysis:
The volume trend is not depicted but is crucial in confirming any potential price movements. An increase in volume on upward price movements would affirm stronger buying interest, while high volume on downswings could signal strong selling pressure.
Strategic Trading Insights:
Given the consolidation phase indicated by the chart, my strategy would be to watch for a breakout above R1 ($6,392) for a potential bullish entry, setting a target near R2 ($7,009) while maintaining stop-loss orders just below the recent lows near S1 ($5,259). Conversely, if the price breaks below S1, I would reassess the bearish potential, possibly positioning for a short if further bearish indicators confirm.
Conclusion:
In conclusion, YFI/USDT presents a balanced scenario with potential opportunities on both the upside and downside. Traders should remain vigilant and responsive to price actions near the key support and resistance levels. Monitoring the accompanying volume and further developments in technical indicators will be essential to effectively capitalize on this market's dynamics. As always, maintaining disciplined risk management strategies is vital to safeguard investments in such a volatile environment.

YFIUSDT.1DReviewing the YFI/USDT chart, I can discern several pivotal technical indicators and trends that are crucial for making informed trading decisions. Currently, YFI is trading around $5,875, which is significantly close to a major support level at $4,594. This price point is critical as it has previously served as a support area, suggesting that it could either provide a rebound opportunity or, if broken, lead to a further drop.
From the perspective of resistance, YFI faces a substantial hurdle at $7,564 (labeled as R2 on the chart). Before this, a minor resistance level at $4,594 (R1) could pose challenges. Overcoming these resistance levels could signal a bullish momentum, potentially driving prices higher.
The current RSI at 47.65 does not yet indicate an oversold or overbought market, suggesting a neutral sentiment in the market. However, the descending trendline from the recent highs indicates ongoing bearish pressure. The MACD, showing a slight convergence below the signal line, hints at bearish momentum with possible room for a turnaround if positive volume can support it.
Conclusion:
With YFI trading close to significant support at $4,594, I am keeping a close eye on this level for potential buy opportunities, particularly if the market shows signs of rebounding here. A strict stop-loss just below this support would be prudent to manage risks, considering the possibility of a further drop if the support fails. On the flip side, any break above the resistance levels, especially $7,564, should be viewed as a strong bullish indicator, potentially opening the door for targeting previous highs. It's essential to correlate these technical observations with market news and sentiment to optimize trading strategies in the volatile crypto market.

YFI looks bearishAfter the big pump, the price has entered the correction phase.
This correction seems to be a diametric.
We seem to be in the g wave of this diametric now.
By maintaining the red range, it can move towards the TPs.
Closing a daily candle above the invalidation level will violate the analysis
For risk management, please don't forget stop loss and capital management
When we reach the first target, save some profit and then change the stop to entry
Comment if you have any questions
Thank You

YFIUSDT 1WYFI ~ 1W
#YFI So far this support line is holding the price of COINBASE:YFIUSD from falling any lower.
Make purchases gradually in this pattern. with a target of at least 15%+ from here.

Alikze »» YFI | Corrective C waveAccording to the previously presented analysis, after exiting the downward channel and pulling back to it, it grew by more than 55% to the specified range. After that, there was a three-wave correction up to the green box range. Currently, two behavioral scenarios can be considered to continue its path.
💎 First scenario: in case of the inability to penetrate and stabilize above 7660, it can continue the corrective movement until the origin of the movement of the OB range.
💎 Second scenario: If it penetrates and stabilizes above 7660, it can continue to grow up to the previous supply area and then it can have its own growth up to the previous ceiling.
»»»«««»»»«««»»»«««
Please support this idea with a LIKE and COMMENT if you find it useful and Click "Follow" on our profile if you'd like these trade ideas delivered straight to your email in the future.
Thanks for your continued support.
Sincerely.❤️
»»»«««»»»«««»»»«««

#YFIUSDT #2h (OKX Futures) Descending trendline break and retestYearn Finance printed a morning star then regained 50MA support, seems about to make another impulse on Low TF.
⚡️⚡️ #YFI/USDT ⚡️⚡️
Exchanges: OKX Futures
Signal Type: Regular (Long)
Leverage: Isolated (6.0X)
Amount: 5.0%
Current Price:
5841
Entry Targets:
1) 5802
Take-Profit Targets:
1) 6188
Stop Targets:
1) 5609
Published By: @Zblaba
CRYPTOCAP:YFI OKX:YFIUSDT.P #YearnFinance #DeFi #Yield yearn.fi
Risk/Reward= 1:2.0
Expected Profit= +39.9%
Possible Loss= -20.0%
Estimated Gaintime= 4 days

YFIUSD - Horizontal BottomA potential bottom structure, look for bounce off the bottom orange line
This could create a reversal pattern which I have shown with the green bars pattern line
Daily chart for YFIUSD


#YFIUSDT #4h (OKX Futures) Falling wedge breakoutYearn Finance regained 100EMA support then pulled back to it after forming a dragonfly doji, looks like bullish continuation is in play.
⚡️⚡️ #YFI/USDT ⚡️⚡️
Exchanges: OKX Futures
Signal Type: Regular (Long)
Leverage: Isolated (9.0X)
Amount: 4.9%
Current Price:
7065
Entry Targets:
1) 7056
Take-Profit Targets:
1) 7374
Stop Targets:
1) 6897
Published By: @Zblaba
CRYPTOCAP:YFI OKX:YFIUSDT.P #YearnFinance #DeFi yearn.fi
Risk/Reward= 1:2.0
Expected Profit= +40.6%
Possible Loss= -20.3%
Estimated Gaintime= 1 week
