Inflation is plateauing and likely to end flat in 2023Inflation is plateauing and likely to end flat in 2023, so what will that impact the markets?
Though inflation peaked at 9% last year and has been declining to 6.4%, CPI seems to be plateauing and may close flat in 2023, but this is not good news at all. Why? Because the Fed wanted to see the CPI or inflation coming down to 2% in a sustained manner.
Studying across the 2-, 5-, 10- and 30-years yield, we are seeing all the 4 yields almost breaking above its October 2022 all time high again. As long as the inflation remain flat at this current level, the Fed will continue its moderate rate hikes.
Therefore, we are expecting more volatility ahead with a flat inflation number.
This is definitely bad news for the stock investors, but not for the traders. Since 3rd week of 2022, I have exited from my long-term hold for the U.S. stock markets to trading the U.S. indices with much anticipated inflation and volatility.
Also, trading into the Micro Yield Futures. Since it is on an uptrend, I prefer to focus mainly on buy on dip strategy.
CME Micro Years Yield Futures
Minimum fluctuation
0.001 Index points (1/10th basis point per annum) = $1.00
Disclaimer:
• What presented here is not a recommendation, please consult your licensed broker.
• Our mission is to create lateral thinking skills for every investor and trader, knowing when to take a calculated risk with market uncertainty and a bolder risk when opportunity arises.
CME Real-time Market Data help identify trading set-ups in real-time and express my market views. If you have futures in your trading portfolio, you can check out on CME Group data plans available that suit your trading needs www.tradingview.com
Yields

What is Lumber Signalling?Lumber has been decimated over the last 3 weeks.
With housing data coming out tomorrow along with PCE. Is this weak lumber chart signaling a continuation of yield strength moving up?
Does the market interpret the housing data as negative?
One thing is for sure interest rates should make a move tomorrow off of the data sets.

SPY...Bulls need to defend this supportThe markets are at an inflection point.
The resolve of the bulls is likely going to be tested very soon.
If the SPY loses this support level it could open up the doors to another 5-7% down.

JPY - ⑊⑊JPY - ⑊⑊ Channel
JPY Still within this channel / Pennant pattern - a break to either direction.
Break above H: 131.360 expect 133 areas
Break below L: 127.000 expect 125 areas
It's clean set up but don't forget to use your own trade plan
Trade Journal

Stocks continue to grind higherDiscussing all the major indices. Market signals and some latest earnings.
SPY, QQQ, DXY. Yields, Gold, Silver, Oil, Natural Gas,

CPI comes in hot, markets don't seem to care. CPI release today spiked yields but tech stocks brushed it off.
Will the divergence between bond & stocks play out in favor for stocks?
We disucss the SPY, QQQ, Yields, DXY, Gold, Natural gas, Oil, Bitcoin, Tesla, Nvidia.

Use of my customs indicator as a trend analysis of NQThis chart uses my Yield/FX indicator to show divergences from the NASDAQ futures (NQ) from the indicator, and thus weakness/strength in the yield/FX calculation compared to the market.
Much like the use of a normal RSI/MACD analysis, divergence from the indicators trend to the indice can be used as a reversal indication signal.

Daily Analysis: Tech weak today, as capital rotates defensively.We discuss all the major indices and markets.
SPY
QQQ
DXY
Yields
Gold
Bitcoin
Inflation

US 10 YR Yield vs SPX hit a resistance that started other bottomZoom out and in Oct US 10 Year yields hit a supply level from Dec 2018 which started that big rally, we rejected hard from that in Oct. Now heading into resistance on shorter timeframes that started the other two major equities bottoms. If this rejects here which I think it can that will keep the rally continuing.

DXY possible breakoutThe DXY is on watch for an hourly breakout.
This is coming on the back of China inflationary numbers.
2.1% YOY inflation
0.8% MOM inflation.
The Month over month came in slightly hotter than expected which could be signaling maybe a hotter US CPI next week.
The China Reopening may be the cause of this.

Disney pops on earningsDisney had a nice rally. Its the rally we have been waiting for.
Finally hitting and fulfilling our upside target we are now accumulating a swing short on Disney.
The level was hit in the post market session and has pulled off the highs nicely.
We telegraphed this trade to our subscribers and were already in the money.

Is Gold telling us something?Gold is forming a picture perfect Bear Flag.
If this pattern breaks and triggers we have 2 downside targets.
The importance of analyzing this pattern is Gold encompasses much of the macro landscape in its price action.
If Gold is acting bearishly based off this pattern it could be foreshadowing a dollar strengthening.
It could also foreshadow perhaps a good jobloss claims number tomorrow that could force yields higher.
Whatever the catalyst may be, based off of this pattern were likely to see some additional weakness in the near term unless we break out of the bear flag upper range.

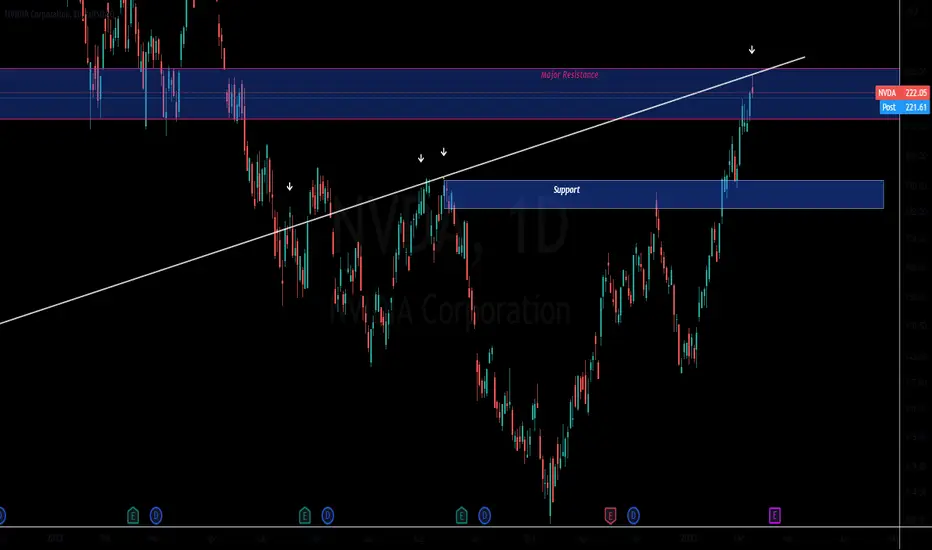
Nvidia Sell SignalNvidia just put in a reversal signal on the Daily chart as it hit major resistance.
This semiconductor has been a powerhouse mover and has single handily been lifting the Semis sector higher.
Now that this stock may show some near term sell pressure we could see the sector as a whole pullback.
The only thing that Im being mindful of when it comes to NVDA is that it has yet to report earnings.
As a technical analyst I'm a bit dissatisfied that Nvidia came so close to filling the technical daily gap at 230.46 but never managed to fill it which leads me to think there may be a possibility it has 1 more gasp at a rally to fill the gap before rolling over.
None the less distribution is being observed in a time when yields and dollar may be spiking again.
Microsoft has likely put in a near term topMicrosoft just provided an epic sell signal to the market.
The extreme reversal on volume after MSFT was up 3% and closed the session negative is indicating the sellers are emerging.
If the second largest company has put in a near term high, we could see the tech sector subdued.
Now we wait for other sell signals.
A 50% retrace is typical after a strong reversal but so is a gap down.

Copper & Stocks DivergingCopper and S&P500 is making a divergence.
Could this mean that we are going to be seeing weakness creep into the real estate market with Lumber and copper falling recently?
SPY has tracked copper closely with the rise & fall in inflation and yields.
The most used commodity in the world should provide pivotal insights into the next turn in the market.
If we do enter disinflation/deflation that's typically not positive for equties despite the "soft landing" narrative.

Daily Analysis: Powell Moving MarketsDiscussing,
Stocks, Powell, Gold, Bitcoin, SPY, Yields, DXY, QQQ
There may be an arbitrage opportunity in the stocks market.
Stocks & bonds diverging yet again.

US10Y Sell this rally.The US10Y is breaking above the first Falling Resistance after making a Double Bottom on the 1day MA200. Wait for the right level to sell this rally near the second Falling Resistance. Target the bottom of the Falling Wedge.
Follow us, like the idea and leave a comment below!!

Crypto feels like a move is coming.Lets see how Bitcoin & a variety of other crypto's are performing.
It feels like BTC and crypto has been semi dormant for the last couple weeks. Will we see a break to the upside or downside?

Are yields about to spike again?Yields saw a massive turn to the upside after the latest job report number coming in red hot.
Showing the US labor force is a juggernaut.
If we see this Bullish consolidation break to the upside this implies interest rates are going much higher.
If this pattern comes to fruition and fulfills it upside targets, this would also imply the likely catalyst that could spike yields even more could be a hot CPI number or additional Labor data.

DXY, SPY, Yields: what the heck happened?Crazy action and reversals. Once again the volatility continues but the vix didnt spike.
We discuss the US Dollar, Yields, SPY.

TLT Trading The MTF Corrective CycleIn this update we review the recent price action in TLT and identify the next high probability trading opportunities and price objectives to target

Meta...What a move!Massive Moves to the upside often see that move retraced over the coming weeks especially if market fundamentals deteriorate.
none the less this stock likely sees a significant amount of profit taking.

Copper is Screaming! Are you listening?Why is Copper so important to track and what can we learn from studying its price action. Copper simply put is the most used base metal in the world and really powers every aspect of world. Doctor Copper is telling us something.
Copper has had an impeccable rally of the lows, this has been confirmed with the major rally in copper mining stocks.
In this chart we have overlayed the inflation rate in orange with the price action in copper.
The inflation rate has a delayed reaction based off of the price action in Copper.
What we can observe recently is the price of copper topping 112 days before the inflation rate. Copper had a significant decline which was followed by a decline in peak inflation.
Over the last 148 days, Copper has rallied 38%. Could this mean that we are about to see a delayed spike in the inflation reading?
