Bonds Attempt to Establish Value Near LowsBonds have picked up from lows, retracing the vacuum zone back to resistance at 126'19, exactly as we had predicted yesterday. The Kovach OBV picked up very slightly, but nowhere near enough to suggest any serious buying momentum. We are seeing resistance from these levels, as anticipated, confirmed by a red triangle on the KRI. It seems likely that ZN may retrace the range again, and find support at 125'17, but if we continue to test higher levels, then 126'18 and 127'01 are the next targets.
Yields

Here is why the Us-Dollar stands still! Pump should come soon!Hey tradomaniacs,
everything I wanna say is mentioned in the chart.
Yields are currently falling due to more demand in Bonds (oversold market) which are attractive for investors who want less volatility.
When there is demand in Bondy yields are moving down (negative correlation) which is dragging down the momentum for US-Dollar which should actually move up when equities fall.
Wait for yields to pump during the sell-off in stocks and US-Dollar will pump.

Inflation, bond yields, the dollar and the Fed! Macro series pt1Part 1 Hello everyone! It's been a few weeks since my last update on the markets, and this one is going to be a very special one. Will go through many different aspects of most major markets, by using both technical and fundamental analysis. It will be an in-depth analysis with lots of charts of several instruments, that have the potential to give us a clear picture of where we are and what is going right now in the global landscape. Because there are so many things I'd like to mention, I've broken the analysis down in different parts, all of which you will be able to find on the links down below.
The first and most important pieces of the puzzle are the US Dollar and interest rates, as together they are one of the largest components in essentially every market as they partially determine the liquidity and demand, by ‘setting a price for money’. In 2020 many forecasters predicted that the value of the dollar would collapse and said it was dead as it had lost 10-15% of its value relative to other fiat currencies. Yet they were very wrong in 2021 as the dollar bottomed and started rising along with interest rates, despite inflation skyrocketing in the latter part of the year. At the same time many claimed that the bond market would collapse, yet even though long term US bond yields had been rising from Aug 2020 up until Mar 2021, just to barely get to pre-pandemic levels where bond yields were already really low. Then went sideways until the end of 2021, where they started rising again. During that time short term US bond yields were close to 0 and only started rising at the end of Sep 2021 as inflation started climbing fast and the market started anticipating the Fed raising rates. Therefore, as those yields were rising due to inflation going up, so did the USD which might seem counterintuitive. Why would it go up if it’s losing purchasing power?
Well fiat currencies are trading against other fiat currencies and the world is heavily interconnected, so it’s a relative game and inflation wasn’t just US phenomenon. However most importantly it was clear that inflation didn’t come due to the Fed doing QE or lowering rates, but due to several other factors. To name a few 1. Government spending, 2. Credit creation during Covid, 3. Deferred loan/rent payments, 4. Wealth effect due to stocks/housing going up, 5. Supply chain issues, 6. Supply shortages due to labor shortages or businesses closing, 7. Pend up demand, 8. Higher demand for goods than services, as well as demand of new types of goods, and finally and most importantly 9. Issues in the energy sector and particularly due to the fact that many oil and natural gas wells got shut and weren’t reopened. Now you might be thinking ‘wait a second, where does QE fit into all of this?’. Unlike what most people believe about QE or low interest rates, the Fed doesn’t print money. It simply creates reserves which the banks can’t use to buy anything and low interest rates are a sign that the economy is in trouble as banks aren’t willing to lend to anyone other than big institutions. QE isn’t inflationary as it is just an asset swap and the Fed doesn’t determine anything aside from short-term rates. So, what does the Fed actually do? Essentially, they are trying to push banks to lend, yet banks refuse to do so, and in turn the Fed tries to manage expectations. It all boils down to the Fed making people believe they know what they are doing and that they are a powerful institution that can either create or fight inflation. Therefore, in the list of factors there is another one (no. 10) which is that the Fed convinced everyone that they flooded the world with cash and that affected the spending/investing habits of the people that believed them. Yet there was a market that hasn’t really believed them, and that is the bond market.
The bond market keeps indicating that we are stuck in a low growth environment where inflation isn’t a long-term issue, just a short term one. It is also telling us that there is too much debt and too many problems, many of which policy makers haven’t been able to solve. Not only that, but many of the policies have been making things worse and worse, and that in 2022 it looks like inflation is probably going to slow down. Hence if markets and the data are telling us inflation isn’t going to be a major issue in 2022 and the sources of inflation are elsewhere, why will the Fed raise rates? Can it raise rates? By how much? What impact will that have on the economy?
For the first question there are some pretty clear explanations. One of them is that Fed wants to raise rates is so that people keep believing in that they can control inflation and that they aren’t just there to pump the stock market. Many believe in the Fed put, which is the belief that the Fed doesn’t want to do anything to upset the markets and that if things go bad the Fed will support the stock market because it can. However, another one is that there are also many people who are upset about inflation and want someone to do something. These people demand the Fed to act, as the Fed itself claims to have the tools to fight inflation and that it created the inflation in the first place. Hence at the moment the Fed is stuck between a rock and a hard place, as markets are at ATHs, housing at ATHs, the economy is slowing down and overall is in a pretty bad place, while for most people the costs of living are up by 10-20% compared to 2 years ago. By the Fed’s own mandates and admissions, inflation above 2% is high (CPI was at 7% YoY) and their reasoning for QE + low rates has been their goal of full employment… and as we’ve reached a point where unemployment is very low and there are even labor shortages as many people haven’t gotten back to the labor force since the pandemic begun. This in turn puts pressure on wages and inflation, hence the Fed has to act based on its own ‘goals’. Yet if they act, and especially if they act quickly, the markets could crash and this could have even more implications on the economy. It is pretty clear that they have to walk a fine line, except it’s also pretty much impossible for their actions not to affect the markets which are overleveraged and are showing signs of weakness. On the one hand they need the markets to come down a bit, in order to slow down the wealth effect which affects inflation, as well as prevent excess speculation from going even further… and on the other hand they must not overdo it because the whole system could grind to a halt.
Keeping all of the above in mind, it seems pretty hard for the Fed to significantly raise rates. Yesterday when Powell started answering questions, he was pretty hawkish because people aren’t taking the Fed seriously, but there is a long way between them talking about being serious and them actually doing it. Doing both QT and raising rates more than 3 times this year, something that the market seems to be expecting at the moment seems a bit farfetched. Like Alex Gurevich said on his recent appearance on ‘The Market Huddle’ podcast (and I am paraphrasing a bit), the most likely scenario for the Fed is to raise rates once. In his view they could do one and not hike again for a decade. Maybe they get two or more, but 1 is more likely than 2, and 2 are more likely than 3… and so on. He also mentioned that he thinks we in the late stages of this cycle, and I happen to agree with both views. My reasoning is that the inflationary factors mentioned earlier seem to be weakening substantially and slowly giving their place to the disinflationary/deflationary factors like supply chains issues being slowly resolved, less government spending, debt accumulated during the pandemic having to be repaid and so on. Inflation in 2021 was really high, though towards the end of the year several data points started showing that it was slowing down and in 2022 we could have 2-3% inflation or even outright deflation. To sum it all up, the Fed will start raising rates too late, as real rates have already started coming up and could go up even higher inflation starts going lower. The impact this could have on an overleveraged market is substantial, something that could force the Fed to stop raising rates and even stop its talks about reducing its balance sheet… or maybe even force them to go back into cutting rates and doing QE.
Up to this point we’ve only talked about rates, but haven’t mentioned anything about the USD and how it could affect entire financial system. This is another very important factor that the Fed needs to be aware off, even if they haven’t been explicit about it recently. The USD is the global reserve currency and most of the world’s debt is denominated in USD, which means that when it goes up relative to other currencies, then debt repayments become harder especially for those who don’t earn USD. At the same time when US interest rates go up AND the USD goes up relative to other currencies, that creates immense pressure on the financial system. That’s because people/institutions have to pay more interest on their loans, while the currency they are earning and need to convert into dollars to repay their debt, is worth less and less. These two factors create some serious deflationary pressures as someone might be forced to cut their spending or even outright sell assets in order to keep up with his obligations. Of course, in a situation where the entire globe is doing well and rates go up because the economies are booming, debt is low, and it just happens that the USD is going up as it happens that the US is doing better than other countries, then the dollar going up isn’t really an issue and neither are rates. However, the dollar going up, especially along with interest rates really is an issue when the world is drowning in debt, economies aren’t doing well, markets are overleveraged and optimized to work well in a low-rate environment. Another thing to keep in mind is that the dollar going up might create a vicious loop by accelerating the sell-off in traditional markets as more and more people sell in order to meet their obligations, or take a risk off stance or to take advantage of higher interest rates or to take advantage of its rise relative to other currencies. At the end of the day the US isn’t an economy that functions in isolation and it isn’t the only one that uses or CREATES dollars. That’s something crucial that many people forget, as even if the US economy is doing great and higher rates might be appropriate for the US, the actions by the Fed could create issues in other parts of the world, which in turn could damage the US economy.

EURUSD - Bearish - Struggling to Break HigherHere is a new SELL Scenario, i expect a stronger dollar
a short term bearish for EURO
US Treasury yields continue to rise
JamdeJam will not accept any liability for loss or damage as a result of
reliance on the information contained within this channel including
data, quotes, charts and buy/sell signals

Expecting yields to take a breather soonAll goes down to CPI readings this Thursday but purely from a technical perspective, US2Y and US10Y are expected to cool down in the next few weeks from their current trading ranges that could go up to 1.4% and 2.1% respectively. If invalidated and they go higher into the coming week, expect more volatility and suffering for the stock market.
US2Y
US10Y

UPDATE: USDJPY Long PositionFundamentals :
See previous updates....
Technicals :
The price moved from bottom to top of the band in what appears to also be a break out and a retracement to support. On top of this, we can see that a chart of US bond yields, which predict the direction of the USD, remain supportive of the USD going forward. Therefore, buying dips on USDJPY. For several other reasons, I prefer UJ first to tackle the benefits of a strong USD in the coming weeks until March 2022. My stop on USDJPY us 113. Targets@ 116.33 and 117.85 or 121.
Positive MACD
Stronger RSI
Pullback to support after a double bottom
Fibs
Horizontal support
Pitchfork support
Daily View:
8 hour view:
8 Hour view scrunched out:
1 Hour Chart view:

Macro study of U.S. economy - Market warning signals?They do not scream "SELL" just yet, but these indicators offer strong caution of further market correction. Please take some time to study the charts so you understand the story they tell. I am not an economist; I am a trader who has been learning more about bonds and macro indicators.
(I have ignored the pandemic drop because it was extraneous to normal economic factors that move markets.)
ISM Manufacturing
> A leading indicator - below 50 indicates contraction
> Peak expansion in 2021 seems to have ended, yet wages have risen - this will pinch corporate profits
> If next month is lower, it indicates further slowdown (slowing expansion)
> Texas manufacturing for Jan'22 showed concerning declines
> Note the readings below 50 from Aug-Dec 2019 indicated a problem. Covid-19 did not cause markets to drop; it exaggerated the move.
HYG high yield bond ETF
> Includes many junk bonds - indicative of economy's credit situation (corporate, municipal, consumer)
> Yellow lines show the beginning of a significant drop that indicated worsening credit conditions
> Note the "valleys" below 85 match with SPY corrections
> Will this keep dropping to 81-80?
CCI - Consumer Confidence Index
> A leading indication of people's optimism about economy
> Red rectangles show significant drops that corresponded with SPY correction
> Does most recent CCI drop reflect more SPY correction?

Bonds Rally with the Stock SelloffBonds have gotten a lift off the selloff in stocks. An influx of risk off sentiment gave ZN a much needed lift back to the 128 handle. We had dipped in the very lows of the 127 handle, and were appearing to get ready to break into the 126's, when the fallout from stocks caused a notable risk off shift. We have broken through our level at 127'22. As predicted yesterday, we crossed the vacuum zone and touched 128'10, the first level in the 128 handle, before retracing slightly. At the time of this writing, we are hovering just under this level. We will see if the fallout in stocks continues today, in which case, we can expect higher levels, the next target being 128'24. The Kovach OBV has turned solidly bullish, likely a bit more than it would if this were just a simple relief rally. But if the selloff continues, 127'22 and 127'08 are the next targets to the down side.

High consumer price inflation is good for borrowers, right? Err…Another Market Myth Exposed
The Nasdaq index has now declined by 10% from its November high , prompting the mainstream financial media to call it a “ correction ” whatever that means. I think they call it a bear market when it is down by 20% . Many stocks have already fallen by at least that amount, and realistically, it’s all semantics anyway.
It’s early days, but what is curious, though, is that high yield , or junk , bonds continue to hold up. To be fair, junk bonds, as measured by the U.S.$ CCC & Lower-rated yield spread reached peak outperformance in June last year and have underperformed since, but yet there have been no signs, as yet, of any rush out of the sector.
I heard an analyst on Bloomberg TV yesterday say that he was bullish of credit, particularly junk, because it does well in an accelerating consumer price inflation environment. The theory is that higher consumer price inflation means that companies can increase prices, thereby increasing revenue in nominal terms. At the same time, though, the amount the company owes via its bonds remains the same, thereby decreasing the debt’s real value and making it easier to service. It’s a win-win situation apparently, and that means junk bonds outperform.
The opposite should be true under consumer price deflation. Junk bonds should underperform because, with nominal corporate revenues declining, the value of debt goes up in real terms, making it harder for corporates to service it.
OK, I thought, channeling Mike Bloomberg’s mantra of, “ in God we trust, everyone else bring data ” let’s have a look at the evidence.
The chart above shows the U.S. dollar-denominated CCC & Lower-rated yield spread versus the annualized rate of consumer price inflation in the U.S . Apart from the period of 2004 to 2006, there’s hardly any evidence to suggest that accelerating consumer price inflation is good for the high-yield corporate debt market.
Junk bonds were only just being invented by Michael Milken in the 1970s, and didn’t come into popularity until the 1980s, but we can examine corporate bond performance by looking at the Moody’s Seasoned Aaa Corporate yield spread to U.S. Treasuries. Doing so, reveals that, in the first major consumer price inflation spike, between 1973 and 1975, corporate debt underperformed as the yield spread widened. In the second major consumer price inflation spike, from 1978 to 1980, corporate debt briefly outperformed but then underperformed dramatically, as annualized price inflation reached 13%.
It goes without saying, of course, that this analysis is just looking at the relative performance of corporate debt under accelerating consumer price inflation. The nominal performance is another matter. Borrowers and lenders ( bond investors ) both got savaged in the 1970s with the Moody’s Seasoned Aaa Corporate yield rising from 3% to close to 12%.
The conclusion we must reach is that the level of consumer price inflation does not matter to relative corporate bond performance. It does, however, matter for nominal performance . More semantics, some may say. What really matters is how it affects one’s wallet.

Aussiethe aussie completed 5 waves up in a leading diagonal form showing that a new impulsive wave has begun.
we are looking to see a three waves pullbakc towards the previous wave 4 before continuation higher might happen.
im looking to long the pair in the coming sessions after completing this pullback.
goodluck

Bonds Ranging Between Our LevelsBonds have edged up, but as predicted, are facing resistance at 128'24. We saw a red triangle on the KRI at this level to confirm resistance. Currently, we are seeking support at 128'10, which we also anticipated. Two green triangles on the KRI are suggesting support here. As discussed yesterday, bonds are establishing value between 128'10 and 128'24. The Kovach OBV has edged up, but has leveled off. If ZN is able to break through 128'24, then there is a vacuum zone to 129'11. Otherwise, we should see support at 128'00.

Big weekly bearish div => Big drop (historically)Hi folks!
Enough said already - just stay out:
- S&P500 has just once been more expensive in terms of most metrics (Schiller PE, P/S, Relative to Money supply etc.)
- Real interests (inflation - treasury yields) have NEVER been as negative as they are now - contributing to huge inequality in society
=> Fed will have to act, and most likely a lot faster than the market suspects - Remember that real interest rates are actually lower now than before Volcker bumped interests to 10%!
The only potential upside to this market lies in even more speculation, and that is not a place you want to be imo.
As I am a trader and do not have the patience to stay away, I just trade the VIX these days, but I do not recommend this
(unless you know how it is calculated and you have a reasonable risk management strategy).
DYOR.
NFA.
I Wish you all well :)

TNX - Deep CrabThese harmonic patterns have been a real hit or miss for me. However I couldn't help, but notice that the fibs alligned so nicely.
The "potential reversal zone" is the 1.618 XA project @ 2.519.
The BC projections of 2.24 and 2.618 (both in grey) were used to define the range of that zone.
The AB=CD projection was also include of the 1.272 and 1.618.
1.272 is an alternate target
1.618 because I like the symmetry with the 2.618 BC projection at 2.254.
Despite labeled with a "potential reversal zone", keep in mind the momentum on this sucker. The 30,40, and 50 week MA look like they are ready to flip bullish in the coming weeks if this thing gains some ground.
Not financial advice by any means. I just thought it'd be fun to share. Best of luck!
harmonictrader.com

US-DOLLAR really falling after NFPs? I doubt it.Hey tradomaniacs,
chaotic market huh?
To be honest... I think the current move of US-DOLLAR doesn`t make any sense.
I keep it simple and short, otherwise I`d have to break the mold.
The data are mixed but do overall show a slowdown in the economy but at the same time rising inflation.
Non-Farm-Payrolls: 199.000 less jobs than expected and the worst result since december 2020. This clearly shows a cool down in the NFP-Sector and is overall bearish for the US-Dollar.
Unemployment Rate: 3,9% and a positive development considering that previous rate has been at 4,2%. Overall bullish fort he US-Dollar.
Average hourly earnings: 0,6% and way higher compared to the previous month.
This is overall bullish for the US-DOLLAR due to higher inflation.
Average weekly hours: 34,7 and less than expected.
The problem here in my opinion is the fact that earnings per hour soared while less jobs were created. This is a typical sign of inflation and part oft he wage-price-spiral.
Considering that FED has to and will fight inflation as its priority number one after their „transitory-fail“ to gain back reputation Jerome Powell & Co could turn from best friends to fiends for the stockmarket as financial injections probably won`t be an option anymore, whether the economy cools down or not.
This is clearly negative for the overvalued equity-market but not by all means for the US-Dollar.
Simply put: The FEDs in a quandra.
Can`t provide more liquidity due to high inflation to push growth and employment and has to hope everything is going to be fine.
Rising yields do indicate expectations for higher inflation in the market and would offer an alterantive to stocks in the near future (Bonds).
They are also generally good for the bank-sector and obviously not good for tecs due to high costs which are not as easier to finance with higher interest-rates.
But here is a catch.. we know how irrational but faithful the market is... if it turns out the market hopes the FED to ignore their plans and "slow it down" in order to boost the economy again if future results are not as good as expected we might see another rally in stocks and so a falling US-Dollar. This would be more like the less likely scenario in my opinion...I mean Bidens is on Powells tail.
Risk-Off is generally good for the US-DOLLAR as a safe haven. If FED continues as announced and planned the US-Dollar is likely to move up while this move turns out to be a fake.
One of these charts is lying, but I see a higher probabillity of a rising US-Dollar under these circumstances.
LEAVE A LIKE AND A COMMENT - I appreciate every support! =)
Peace and good trades
Irasor
Wanna see more? Don`t forget to follow me

Relation Between uncertainty and United States Bond YieldsA simple economic condition: Uncertainty UP - US Bond Demand UP - Bond Prices UP - Bond Yields DOWN
This case study focuses on Covid news and investors reaction to uncertainty.

Yields Soar, Treasuries Smash Lows!!Bonds have tumbled off soaring yields. Rising inflation seems to be one of the key drivers, along with paradoxically increasing risk on sentiment in stocks, as the indexes are testing new highs again. ZN smashed through support in 130 handle. We saw absolutely no support from 130'00, the final barrier to the 129 handle, and even less from 129'26, the first level in the 129's. We finally bottomed out (for now) at 129'11, one of the levels we have identified months back using inverse Fibonacci Extension levels. The Kovach OBV has fallen off a cliff with the selloff, but appears to be leveling off as the price stabilizes here. Anticipate some ranging at current levels are digested. The next level down is 128'24. If we catch a relief rally, then 129'26 should provide resistance.

Are Treasury Yields Bottoming?It appears that 10's are coiling up with two potential trendlines to watch (converging orange lines on the chart). Since failing just under 1.70 three weeks ago the latest trend has been down despite a more hawkish Fed and rising 2-year yields. This has led to dramatic flattening across the curve before the latest FOMC meeting. Ahead of Wednesday's announcement, US breakeven rates had fallen to 2 month lows, suggesting since the final stimulus plan was signed in late November that expectations for future inflation could finally be in the process of being addressed. Even after the Fed's meeting, breakevens still seemingly believe that Powell & company are about to embark on a tightening cycle next year with 3 hikes being currently priced by the market for 2022. Although, breakevens still look to go lower, the latest price-action suggests they could be on the verge of starting to stabilize. And 10's too may be attempting to bottom-out as well. For that to happen, however, 10's have to hold the 1.39/1.40 area before turning attention towards the downward sloping trendline ahead of the 20-day moving average. Moreover, with the latest stabilization in the persistent curve flattening trend could also be suggesting more stable rates at the long end of the curve. The one factor to watch that could delay a possible move-up in US yields is covid pandemic, which has unleashed severe year-end profit-taking in the highest performing stocks and overall burdened equity markets around the world.

Fade the rally in yields: What is the bond market telling us?We stand at a crossroad. First, market conditions mirror the global economy in 2018. Back then, the FED was getting to raising rates when the Eurodollar curve inverted. Flattening US bond rates too indicated that economic growth in 2019-2020 would would slow.
Now, the FED is expected to be aggressive on asset purchases taper in next week's meeting. Three rate hikes have been priced in the markets with the first rate hike in May 2022.
A ghost from the past - inverted Eurodollars & flattening US bond yields - is back to haunt the markets. This implies growth is expected to slow down at least during the next two years.
It is important to notice the bounce in US yields should be used to fade out of equity positions in the recent rally and into bond positions across the curve. Buy long-term, sell short-term durations.
Bond volatility has soared I think the past two weeks indicating that something heavy is brewing under the surface.

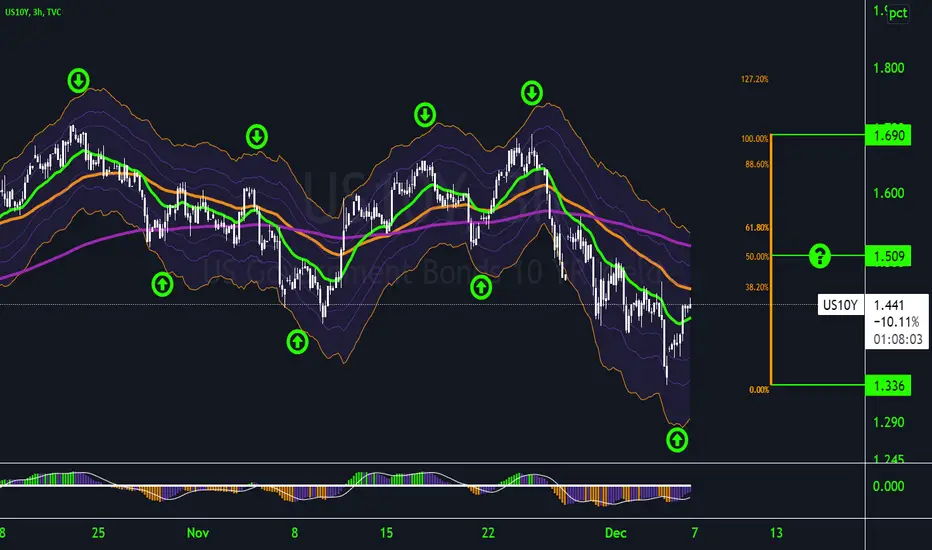
US 10 Year (Updated)I didn't publish the original chart but.....Looks like our 50% target has been cleared and might have rejected the 61% retracement of the previous high. On the 1 hour timeframe, we made a new high and could be time soon for a small retracement to the previous low. a retracement to 1.45 target would be a 38% retracement of where the yield is currently at. Let's see what happens! What do you think?

US10Year YieldIn my most novice opinion, the correlation of the the yield to SPY correlation has been off a bit due to a mix of tax sell offs and maybe some Omicron fear. However, although we are in a area in opinion, we should still be careful and watch how the correlation moves as we close out the end of 2021 and as we head into next year. GDP growth is slow but has been steadily recovering. Now it's a battle between new fear and prior recovery boost. It's been a movie. Let's see what happens!
Bond to Bitcoin CorrelationHere is a brief correlation between bitcoin and bond price action. Hope you find this useful! I haven't been posting much due to what's going on in the economy. Switching up my approach. We all know when bonds rise, yields fall. When bonds fall, yields rise. Think about this when reading this chart. Good luck to the HODL!
Feel free to follow or simply keep up. I'm working on getting better always so bare with me. We all know what kind of journey this is!
Would love your support!

US 2Y Yields Spikes!!US 2Y bond yields melt up are the Central Banks losing control of the narrative and inflation continues to skyrocket causing pain around the world. AU2Y yield faced the same fate not to long ago. Yields have an inverse relationship to bonds as investors no longer interested in holding government bonds the sell and this selling causes higher yields.
Follow me at my other social medias. Crypto mining discord is a must
linktr.ee

gold keeps running ?this analysis is based on yields analysis and their correlation and other xauxxx analysis.
i will buy the dip in this week (or next week) and hold it for higher prices .
