SPY Cycle Patterns For Dec 12, 2022 - More sideways melt-up.Here are the SPY Cycle Patterns for this week.
Expect more sideways melt-up trending as we head into the Fed rate decision and key economic data.
Traders will start to shift into early 2023 expectations this week (after the Fed). Check out my other posts.
The markets are not expecting anything extraordinary right now - more of the same.
The Fed rate decision will likely come in between 50pb and 75pb (as expected).
All of this has been BAKED INTO the markets already.
I can tell you what I'm seeing out here in So. Cal... Shoppers EVERYWHERE. Traffic is a mess. Lots of our of state cars everywhere. Malls and shopping centers seem packed.
From what I can see, Q4:2022 will probably stay very solid for retail and online shopping. Unless there is some catalyst to BREAK the markets, US stocks should slide into 2023 with fairly strong expectations.
Follow my research.
Ym

ES Critical Zone - 3990-3995. Watch for a melt-up trend this wee#ES 60 Min Zones for this week.
Support: 3912 & 3960
Resistance: 4018, 4058, & 4101
Trigger Zone: 3990~3995
I expect a melt-up to continue as expectations for 2023 settle into the EOY trends - likely attempting to break resistance at 4058 & 4101.
Follow my research.

E-MINI DOW JONES ($5) FUTURESE-MINI DOW JONES ($5) FUTURES
A very strong landing as we analyzed and broke the forces of the zones of support and demand and God willing to continue landing

DXY will find support above 103.70As the global economy continues to recoil after the US Fed rate increase - watch for the USD/DXY to find support above 103.70 and flag sideways/higher over the next 15+ weeks.
I suspect any continued Fed rate increases will put further pressure on global markets/currencies and drive foreign investment in USD assets throughout 2023.
Yes, the US economy is contracting - which is exactly what the Fed wants (breaking inflationary trends). But, that does not mean the US economy is CRASHING.
What is happening is the strength of the US economy/USD is creating a capital-shift we've not seen since the early 2011~2013 bottom.
Foreign investors are rushing away from risk - towards safety, security, & ROI. That means they are seeking the safest, strongest economy on the planet, with the best chance of ROI.
I believe that is the US economy (the strongest on the planet) which is currently ON SALE at a 40% to 70% discount.
Pay attention.

SPY Cycle Patterns for Dec 5 thru 9 - A Flat Sideways Melt-upI love the fact that traders are messaging me asking questions regarding my SPY Cycle Patterns. Thank you.
I hope all of you are starting to see some value from my research and using it to profit from some of these moves higher.
Right now, and probably until next week (Dec 12 of later), the markets will probably slide into a fairly volatile sideways melt-up phase. I'm expecting a 4 to 6%+ volatility range over the next 7+ trading days before some catalyst sends the markets higher.
I've listed all the SPY Cycle Patterns for December below. I've highlighted the key days (**) that I believe will create a bias trend in December. The other patterns may still represent upward trending and volatility.
12/1/2022 Flat-Down
12/2/2022 Harami-Inside
12/3/2022 Tmp-Btm-102
12/4/2022 GAP22 Potential **
12/5/2022
12/6/2022 Top
12/7/2022 Flat-Down
12/8/2022 Break-Away
12/9/2022 Carryover
12/10/2022 Tmp-Btm-102 **
12/11/2022 Top/Resistance21
12/12/2022 Consol-210
12/13/2022 Tmp-Btm-102 **
12/14/2022 GAP-Reversal
12/15/2022 Breakdown201
12/16/2022 Break-Away **
12/17/2022 Carryover
12/18/2022 Inside-Breakaway
12/19/2022 POP **
12/20/2022
12/21/2022 Top/Resistance
12/22/2022 Flat-Down
12/23/2022 MntmRally-012 **
12/24/2022 GapUp-Lower
12/25/2022 Rotation
12/26/2022 GAP-Reversal
12/27/2022 Breakdown201
12/28/2022 MntmRally-012 **
12/29/2022 GapUp-Lower
12/30/2022 Top
12/31/2022 Flat-Down

The Santa Rally Continues - Don't get stuck in Perma-Bear modeFar too many people got burned over the past 24 hours by betting the FARM on the Fed coming out Hawkish.
I was chatting with a guy on Twitter last week about his call for a deep selling phase (possibly reaching COVID lows) in the US markets. His followers got burned by today's move (some really badly).
You have to shift with the market trends and prepare for the unexpected.
My research kept my followers away from risks and has been pointing towards a Wave-5 rally setting up in the US markets for many months.
I use my Custom Indexes to get a better "feel" for how the markets are reacting to various inputs/outcomes.
My Rotational Modeling system has been cautious for more than 14+ months - off only -6% for 2022. Many other Hedge funds are off by at much as -40% to -60%.
Days like today, if you were lucky enough to survive them, will teach you a few lessons...
Don't get married to a trend
Protect capital at all times
READ THE DATA - not the emotions
Price can fool you - so protect your position.
Follow my research.. Or, at least, check out my content before you decide to place your trade.
Check out my SPY Cycle Pattern posts. Ask questions if you have them.
This move isn't over yet.

SPY Cycle Patterns for Nov 28 Thru Dec 2 - A Sideways Melt-upThis week, I expect a bit of a sideways melt-up before the Dec 7 start of the Santa Rally.
The markets are digesting the post Thanksgiving trends and may continue to stay in a fairly narrow range over the next 7~10+ days.
I do believe a critical Fibonacci inflation point is likely before Dec 7~10 - prompting a moderately strong Santa Rally phase to start.
Reading some of the comments on Twitter, analysts and various traders seem to be all over the place. Some are calling for a massive price collapse to take place. Others are suggesting a new rally phase will take place.
What I can tell you is that, which you should be watching my Youtube videos to follow my Custom Indexes, global traders are shifting capital away from global risks and into US Dollar based assets. This trend will likely continue for many months still.
The unwinding of global speculative excesses (particularly in nations which saw big increases in home values - think China/Asia, Canada, others) and/or those caught in the pre-Covid excess credit/debt trap (the cheap USD carry trade) will likely continue to struggle as the "revaluation event" puts even more pressure on these foreign markets.
Canada is an interesting example. A fairly strong economy that saw a big increase in wealth, asset valuations, and investments before, through, and even after COVID. The excesses were fueled by a global speculative phase (rising prices), almost like a "tulip bubble" where everyone through "I can't miss this incredible opportunity"... So they jumped in AT ANY COST.
Just like what we saw with Bitcoin, the downside to that rally may be a -50% to -70% decline of certain assets over time.
One must try to understand that when an environment of weaker asset growth (homes and other tangible assets) settles in throughout the world, capital will seek three things:
Safety
Security
ROI
You can't find these three things in extended underperforming assets (think China/Asia, Canada, others). That capital MUST move towards any economy that will contract the least, has the strongest base valuation correlation, and has the potential for moderate earnings, revenues, and RECOVERY.
In my opinion, that is the US, UK, and possibly Japanese markets.

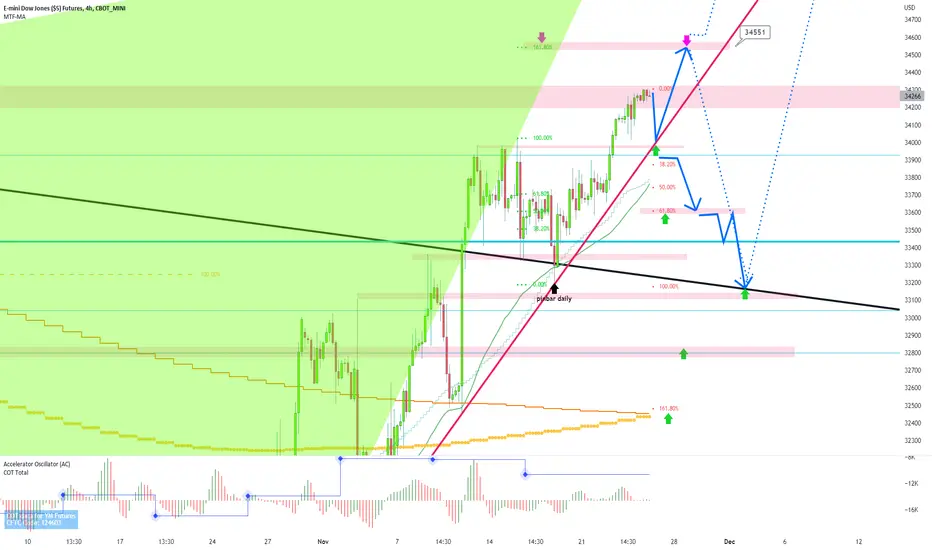
dowjones 4hour : all scenario on dow 1-70% go down and touch support and go up to fibo161
2-30% go down break support and go downer
above green arrow after pinbar come on 1hour or 4hour or daily chart we must buy Sl: pinbar low and hold to new high ok?
if you have old sell,you must close all or hedge them in fibo50 33760-33770...dont forget dow,index, dax sp500 and gold love buy and uptrend so sell on them is very very dangerous..check weekly chart exactly
note: as predict 10 days ago in low dow can go to 35000 even 3600 so be careful from sell and 90% looking for buy
ALERT: END OF YEAR UP TREND RALLY ON INDEX LIKE DAX NASDAQ SP500 AND DOW CAN START
good luck
SPY Cycle Patterns For Thanksgiving Week - Sideways Melt-UpHere you go. This week I expect the markets to melt upward with a couple of bottom/momentum bottom patterns as well as holiday trading liquidity.
This week may see some volatile price swings, but overall I believe the US markets will continue to melt upward.
As we near the end of the year, I expect some traders to try to pull out of positions (anchoring in tax losses) and repositioning early in 2023.
Enjoy your holidays with family/friends.
Follow my research if you are looking for more detailed analysis of the US/Global markets.

DOW 4hour : year end rally can start, dow can go up to 36000strongly advice dont pick sell, looking for buy signal and buy pinbar for hold to new high
if you have old sell you must close all near 33000
good luck

Dax daily long-term : technical say dax can go to 19000 FOR ALL INDEX FROM DOW TO NASDAQ : we strongly advice 90 percent looking for buy and be careful from sell
dax 1st target is fibo61% 14500 and if break it and high can start wild trend to new high 19000 in 2023
keep monitor AC indicator on dax 4hour chart ok?
if you have old sells you must close all above 13950 support
note: COT data in chart below is for big banks net open order on dowjones futures YM1!
wish you win

SPY Cycle Patterns For Nov 14~20, 2022 - Rally Week ContinuesThe incredible rally last week as traders flooded into US & Foreign market assets. The US Dollar rolled downward. Cryptos blew up and continued to tank.
Traders are assuming inflation data will continue to trend downward and are viewing many foreign assets as "undervalued".
You have to attempt to understand the psychology of the markets/humans and the seasonal cycles at play. On top of all of that, we have to consider the fact that the US economy is still much stronger than almost all other foreign economies right now.
As I keep saying, this is a Foreign Market Crisis (credit/debt related to the 2008-09 GFC crisis) and the low-interest US Fed Policy. Easy money policies created a massive speculative bubble phase throughout much of the rest of the world.
The global economy was rolling. Real Estate prices rose - causing a perceived wealth growth that was heavily leveraged. This creates a massive deflationary/revaluation process to unwind in the near future. We have not seen the end of the unwinding, but we have seen the foreign markets move far enough downward to attempt to begin to form a base.
The US markets, with the current CPI data showing weakening inflation and US Real Estate data showing a strong collapse in demand/sales, will likely attempt to MELT UPWARD over the next 90+ days.
But I still want to warn everyone we do NOT have any confirmed uptrend using my MRM Rotational Modeling system Bullish Trend Trigger on the Daily chart. This means, no matter how much we want to chase this rally phase, we should only be deploying a very small amount of capital into any trading activity. RISKS are still very high right now.
If the MRM system changes to bullish on the Daily chart, then I will address allocation levels and the potential volatility risks.
11-13: Bottom
11-14: N/A
11-15: N/A
11-16: InsideBreakaway
11-17: BreakAway
11-18: WeekendGap/Flat
11-19: Gap Up-Higher
11-20: Consolidation
11-21: CRUSH
Looks like we are going to have a fairly good week with higher trending.

dow 4 hour : are you ready for sell ?wait pinbar come on 1hour or 4hour or daily candel then sell with sl on pinbar high
good luck

SPY RALLY WEEK - Are you ready for it?I continue to post these SPY Cycle Patterns as a way to help educate and explore my research/results.
The interesting part of this research is these patterns originate at an anchor point nearly 5 years ago and continue to produce valuable predictive results for each week going forward - all the way out to 2028 and beyond.
Why are they so important?
Because they can help you understand how cycles, price patterns, and psychology play a role in future price activity.
Of course, they are not 100% accurate as news items, the US Fed, and other (govt) actions may disrupt the cycle pattern trends. Ultimately, these are some of the best predictive solutions I've seen related to preparing for future trends/expectations in a long while.
Elliot wave is a great tool, but it adapts to future price movement. Therefore, what you see and believe is going to happen right now may not be valid in 2 to 5 days.
Fibonacci is probably the most valuable solution for attempting to develop any type of predictive modeling - besides my Cycle Patterns.
Well, this is all just conjecture related to what I believe.
Here we go - RALLY WEEK. Let's see what happens.
Most of November 2022 is looking quite bullish. So we may see a fairly strong start to a Christmas Rally setting up this week.
11-6: CRUSH - I expect this pattern to push into Monday, driving a fairly strong upward trend.
11-7: Flat-Down - this pattern may transition into early Tuesday, but quickly move towards the BreakAway trend.
11-8: BreakAway - This pattern should carry through most of Tuesday/Wednesday.
11-9: Rally - Off we go.
11-10: Rally - Continued rally (short squeeze)
11-11: Rally - possibly a stalling rally phase headed into the weekend.
11-12: Carryover - the weekend will setup as a pause, rotation, bottom for early next week.
11-13: Bottom
Follow my research..

Cycle Patterns for Nov-2022 - Enjoy the November RallyThank you to all of you who have been curious and asking questions. This past week I've been busy taking care of family issues and coding.
I'm still deep into researching cycles, frequencies, and cycle trends. Often, I take drives to clear my head and think about things.
Just last Wednesday, I came up with the idea that multiple cycles may be operating on different levels within a price chart (almost like the Multiverse) - but slightly different.
My thinking is these cycle structures are PAUSED when a primary cycle trend is active. So, there may be 5+ various cycles operating on a chart, but only ONE (the primary) is active at one time with a secondary cycle structure possibly driving shorter-term price structures.
I'm going to dig into this to see what I can find out.
Here are all of the November Cycle Patterns:
11-1: Bottom
11-2: UP/Down/Up
11-3: Base/Rally
11-4: BreakAway
11-5: Carryover
11-6: CRUSH
11-7: Flat-Down
11-8: BreakAway
11-9: Rally
11-10: Rally
11-11: Rally
11-12: Carryover
11-13: Bottom
11-14: N/A
11-15: N/A
11-16: InsideBreakaway
11-17: BreakAway
11-18: WeekendGap/Flat
11-19: Gap Up-Higher
11-20: Consolidation
11-21: CRUSH
11-22: FlatDown
11-23: BreakAway
11-24: Carryover
11-25: Temp Bottom
11-26: Gap Reversal
11-27: Breakdown
11-28: Momentum Rally
11-29: Gap Up-Lower
11-30: TOP
Let's keep the chat going....
Have you found these cycle patterns useful?
Have you checked out any of my other research/charts?
What would you like my research to focus on?
How can I help you improve your trading?
Remember, these cycle patterns are mapped out into 2028~2029. They don't change AT ALL. I can tell you what will happen on any specific date based on my research.
Are you ready for a fairly big rally in November? It sure looks like the US markets are in for a bit of a momentum rally phase.

DOW 4HOUR: we can sell now as predict 3days ago dow touch fibo 61 it is so clear dow dax and many index have sell now but daily chart trend can go to 35000
if you have old sell you must close above 31250
good luck

Dow 4 hour : 3 best place for sell after pinbar comesas predict 1week ago in low ,dow reach 31500 area ,,, in next 3 month it can reach 35000
alert: BE CAREFUL FROM SELL, DOW CAN FLYUP WILD AND DONT ALLOW YOU CLOSE SELL SO PUT SL
if you have old sells close or hedge them above 31000
wish you win

Custom Cycle Patterns Update - Christmas Rally Setup 2022It appears I'm getting a few people that are following my Cycle Pattern research - love it.
For those of you that have not been following my research, here is a short history.
Many years ago I started researching cycles, Fibonacci, Gann, and other advanced techniques. I try to deliver all of my advanced research to those that are interested in what I'm doing.
Ultimately, I hope to unlock a few secrets related to how I see price action and attempt to better understand how cycles, patterns, frequency, amplitude, and shifting cycle phases really work in price cycles. If I'm able to do this, I should be able to accurately predict when and how markets will shift into different phases and how to trade them more efficiently.
Much of my research is now dedicated to understanding global market dynamics (the world market trends and what comes next). I have to say I've been quite accurate in my predictions over the past few years - but predicting the future is now something I can do accurately or easily. Yet, I continue to try to provide valuable information for everyone interested.
I warned of a market top setting up in July/Aug 2021 and warned everyone to start protecting trades and pulling profits as the US markets continued to peak.
I warned of a 3 to 5 wave correction taking place (a wave 4 downtrend) before a new Wave 5 (uptrend) was likely to potentially setup a Christmas Rally in 2022.
I've been actively suggesting the US markets were bottoming over the past 60+ days as long as certain support levels held up.
I believe Gold and Silver will start a very strong price rally once the US Dollar shifts into a sideways/downward slide (which may be happening right now).
I also believe foreign market ETFs & Technology shares will be the HOT TRIGGERS over the next 6+ months as investors attempt to buy deeply undervalued stocks.
What this means is we are going to go through a bit of a SHIFT in how capital is deployed and where to find opportunities over the next 6~12+ months.
But it also means traders/investors still need to be cautious. This is not an easy market to trade - and you should not start loading up on ETFs/Tech until we know the bottom is set.
Here is the complete Cycle Pattern for all of October and early November:
10-1: Consolidation
10-2: Temporary Bottom
10-3: Gap Reversal
10-4: Breakdown
10-5: BreakAway
10-6: Rally
10-7: Carryover
10-8: Bottom
10-9: N/A
10-10: N/A
10-11: Inside/Breakaway
10-12: Harami/Inside
10-13: CRUSH
10-14: Gap Potential
10-15: Gap Reversal
10-16: Breakdown
10-17: BreakAway
10-18: Carryover
10-19: Temporary Bottom
10-20: Top/Reisistance
10-21: Consolidation
10-22: CRUSH
10-23: Gap Potential
10-24: Gap22 Potential
10-25: N/A
10-26: Breakdown
10-27: Harami/Inside
10-28: CRUSH
10-29: GAP Potential
10-30: Top/Resistance
10-31: Consolidation
11-1: Bottom
11-2: UP/Down/Up
11-3: Base/Rally
11-4: BreakAway
11-5: Carryover
Remember, CRUSH patterns are BIG TRENDING BARS. They can be UP or DOWN, but generally, they tend to be downward bars (about 65% of the time).
Take a look at the end of October and early November.. It looks like a BOTTOM/BASE is going to setup in early November. Can you say "Christmas Rally"? It looks like we may see a shift in the US Fed attempting to make sure they don't break assets over the next few months.
Follow my research. This is going to be a great opportunity for the right trades/investments. Watch GOLD & SILVER. I believe these assets will move strongly higher over the next 12+ months.

Drop to station 29300We see the fake break in dji ... and it is expected that the next support will drop

A little Elliot Wave Fun - are you ready for what's next?If you are like me, thinking the US markets will act as a safe haven for global capital, then you should clearly see the upside potential if these recent lows hold.
If not, then you are seeing the downside risks as more likely - and will want to understand the price structure in place that may prompt some consolidation.
IMO, we are amid a Wave 4 correction.
Any Wave 4 correction MAY turn into a new price wave structure (ending an ABC wave and starting a new price wave). So, the reality of the current global market trend is...
If my analysis is correct, we must rally to new all-time highs. For this to happen, a broad shift in investor sentiment needs to take place.
If my analysis is incorrect (related to this being a bottom for the US markets, then we would be anticipating a broad global crisis event related to debts/inflation and other emergencies.
I think the US Fed will move to a more moderate rate adjustment schedule while the global central banks deal with credit/debt issues. It does no good to crash the markets to stop inflation.
Just like in the 70s & 80s, inflation will weaken as rates stay elevated. It is just a matter of TIME and POLICY.
Capital WILL seek out the best investment vehicle in the future. I believe that will be the USD and US ASSETS.
What are your thoughts?

CPI/JOBS Blow a Hole in support - CRUSHED? Cycle Pattern UpdateIf you were watching the markets this morning or were caught unprepared for the huge CPI numbers (which lag), you were probably sweating bullets watching the NQ fall 400+ points in just a few minutes.
These reactionary types of price swings can be very dangerous for some traders - especially right now.
But, I want to alert you that the NQ has rallied nearly 200+ points off the morning lows and may turn positive by the close of trading on Friday.
Do any of you remember my Cycle Patterns? Take a look at 10-13 (CRUSH).
10-10: N/A
10-11: Inside/Breakaway
10-12: Harami/Inside
10-13: CRUSH
10-14: Gap Potential
I think the Gap Potential for tomorrow may reflect an upward price gap and may surprise traders if this support level holds.
Next week looks very interesting...
10-17: BreakAway
10-18: Carryover
10-19: Temporary Bottom
10-20: Top/Reisistance
10-21: Consolidation
I see quite a bit of volatility over the next 10+ days while Earnings and the Fed play central roles in driving price trends.
I'm still cautiously optimistic that we'll transition into a Christmas Rally phase throughout most of October. Watch for the US markets to try to setup a base/bottom over the next 4+ weeks.
If the market recovers from this morning's lows - lookout. That should be a fairly clear sign the US markets are defending this support level with a vengeance. Damn the Fed!

Elliott Wave View: Dips in Dow Futures (YM) Might Find SupportDow Futures (YM) shows incomplete bearish sequence from 1.5.2022 high favoring further downside. The decline from 8.16.2022 high is in progress as a double three Elliott Wave structure. Down from 8.16.2022 high, wave A ended at 30975 and rally in wave B ended at 32789. Index extends lower again wave C towards 28635 which completed wave (W). Rally in wave (X) is currently in progress as a zigzag structure as the 60 minutes chart below shows.
Up from wave (W), wave ((i)) ended at 28974 and dips in wave ((ii)) ended at 28772. Index extends higher in wave ((iii)) towards 30399, and pullback in wave ((iv)) ended at 29933. Final leg higher wave ((v)) ended at 30513 which completed wave A. Wave B pullback is in play to correct cycle from 10.3.2022 low before the rally resumes. As far as pivot at 28646 low stays intact, expect dips to find support in 3, 7, or 11 swing for 1 more push higher to end wave C of (X). Afterwards, Index should resume the decline lower in wave (Y). Potential target lower is 100% – 161.8% Fibonacci extension from 1.5.2022 high at 22560 – 27022.

Cycle Patterns Seem To Dominate Predictive TrendsI find it very interesting that my Cycle Patterns predicted the following more than 2 years in advance of this move..
9-26: Breakdown
9-27: Harami/Inside
9-28: CRUSH
9-29: GAP Potential
9-30: Top Resistance
10-1: Consolidation
10-2: Temporary Bottom
10-3: Gap Reversal
10-4: Breakdown
10-5: BreakAway
10-6: Rally
10-7: Carryover
10-8: Bottom
10-9: N/A
10-10: N/A
Given what we saw with the SPY price over the past few weeks, could you have identified the Consolidation, Temp Bottom, Gap Reversal, Breakaway, Rally phases this week after everyone else seemed uber-bearish?
I know they are not perfect yet, but I'm impressed that these cycle patterns seem to be 60% to 70% accurate within a 48~72 hour window. If they continue to perform well, we should be looking at a MELT UP over the next 10+ days that may start a new Christmas Rally phase.
Follow my research.
