VIX - Daily Contract Range ( NQ ES YM )The VIX broke its .500 by 2 Ticks to pull back towards its 22.25 Support Level.
VXN, no different, the pullback towards its Support from the Measure move of
the GAP to the Highs.
The indices will complete their retracement measured moves ahead of the
FOMC tomorrow, entirely normal after yesterday's extremely large Volume Sells.
We anticipated a Retracement back up ahead of the FOMC. It is normal and useful
as the SELL Fills in the DOM await.
Price will move to its 200SMA after this retracement is complete.
The Die as they say is cast for Lower Prices, as we have indicated the 200SMAs
will not hold but create a failure towards the 400SMAs.
_________________________________________________________________________
NQ - Daily Range 14807 - 15708
The retracement Levels for SELL Fills:
15258
15364
Gap Fill Open
The Objective is 12754
_________________________________________________________________________
ES - Daily Range 4294 - 1550
The retracement Levels for SELL Fills:
4421
4452
Gap Fill Open
The Objective is 3982
_________________________________________________________________________
YM - Daily Range 33478 - 35548
The retracement Levels for SELL Fills:
34512
34753
Gap Fill Open
The Objective is 28.200 to 31,000
________________________________________________________________________
Summary
Market Structure observations proved to be correct. The Trade Plan was executed and
closed successfully.
The Markets are weakening and moving to their 200SMAs, we do not anticipate this
the level will hold but move lower towards the 400SMAs.
Divergences that had been building for several months came to pass.
3x and 4x divergences take time to resolve, we are nowhere near this in
time.
As this unfolds it will fool a great many who have been trained to BTD.
Inexperienced Traders are now touting Dow 37.000.
Not going to happen, Price has a great deal of work in a Southerly Range.
The Flash Crash began and ended yesterday. It will be back in force again shortly.
Creating Lower Lows.
We will see where the Backtest attempts to gain its FILL. The trendline or the
Gaps above.
There is no Gap and Trap, our indicators remain Bearish.
Pirce has failed the Momentum Line.
The 100 SMAs were tested, for now, the 50SMAs could be backtested with an
overthrow.
ROC's should return to their respective Centerlines @ 0.
Micro Counts completed, a reversal is to be anticipated.
_______________________________________________________________________________
Any retracement higher will be met with further and intensifying SELLS.
"Buy the Dip" will be crushed again, after this retracement.
The VIX remains the Guide.
Trade Safe and Prosperous.
- HK
Ym

YM - 31K remains ObjectiveThe larger issue will be whether or Not they trap SELLERs looking for the
Monthly Gap Fill @ 28.2K.
The DOW has been weak on a realtive Basis given the 34053 has Broken, this
was important Support @ Monthly.
Support lies at the 34139 level on the Weekly closing basis.
This will imbue SELLERs as technical support is @ 33120 followed by 31848.
The channel would have to give way to imply a Flash Crash continues, it has been weak
support for now.
Real LT Support is at the 28,200 to 31,000 levels, a wider range should the Gap Fill
on the Monthly basis be in Trade.
It remains, far too early to provide a solid indication and trapping Gap Fill traders
would be ideal for a sharp reversal.
Again, far too early to indicate, but trade plans have worked well, we do not want to
overstay our welcome as these Objectives come into Trade.
Privately to PB we indicated the Flash Crash would occur this week, it was left out of the
Public Domain for obvious reasons, good to see it come together.
- HK

ES - When in doubt / Zoom OutThe ES MONTHLY Range is enormous, we see 1/5 ending @ 3588, 2/5 Ranged for less than 2 months
prior to lifting off unimpeded for 7 Months.
Month 8 did make a new high, although the 26 year probability of it holding and closing over is a low
probability event as we indicated in early August.
Many trading Paradigms have been tested and rejected within the Shorter Duration Timeframes.
From my POV, the largest indication was the Break Away Gap in the DOW (YM) off 28,200. this had
never occurred before - the anomoly at this level informed Traders, the Federal Reserve went ALL IN.
And they did - M2 began an unprecedented move higher.
The Longest Bull Market in History is within its Death Throes... the violence within Price will become
even more extreme as we advance to the larger Bear Market ahead into 2022 after completing 5/5.
It's what happens in between which should be of concern - what arrives thereafter is well beyond
mere mortals ability to effect change. It will, no doubt in my mind alter Humanity itself in ways
most all ill-prepared to conceieve.
The United States has been successful in Exporting its "Culture" for decades, this too shall pass.
Pride will give way to hubris at some point, by then it will be far too late to affect any menaingful
change until a more rational generation takes up the challenge... perhaps.
Many will simply give up.
Between now and then, a great deal can occur. Death throes are violent affairs.
The "Disclaimer" should read something like this:
Price tends to behave irrationally within the current environment. All one can do is read the
proverbial Tea Leaves - of which there are thousands...
We are now trading the "Confidence Cycle" and we see how that collapsed in August. It is more
akin to the large vessel in Harbor, slow to turn, methodical and not without challenges.
Quite frequently over the past year, when we see Price dip-in to the 50SMA we see a violent
rejection and retracement. We saw this 9 Days ago when the FED posted $12B in Coupon purchases
to defend the Hourly "Death Cross' - it did not stick, but provided the Higher FIll for Wall Street
and its friends only to move lower again.
it is when we begin moving Down in rapid Extensions, out of Measured Moves... this is when the
Indicies can become angry for a reversal.
This is ahead into October.
As noted in prior posts on several Timeframes from 15min, 4Hr, Weekly and now Monthly... we can
devise a Trade Plan based upon entry into the larger Trend (Down) with the practical and only
set of tools we have - Price/Data/Senitment.
Drawdowns will be required, but will be rewarded. We see this in Bonds, patience... patience and
furher patience. Setups requie time, money and patience.
The Federal Reserve will do what it will to manage Price in to follow suit of the Data and Sentiment.
We simply Obey, as this, again... is well out of our control. It's very Orwellian, dystopian and many
other unseemly Nouns, Adjectives and Adverbs... those are for History to pen and stroke.
The 4400 Level will be extreme in it's importance as should Price Fail within the 15min Falling Wedge,
we can see the 100SMA being challenged next - the issue is every time this has cocurred, we have seen
a reversal to defend the Uptrend.
We are no Longer in an Uptrend.
Anything can and will happen, we will need to be keen observers of a number of indications which were
outlined in prior posts this weekend.
There is no easy answer, none. Price will tell us evrything we need to know.
Beyond Price, many of the Fundamental Vectors have been discussed repeatedly... in enough detail to
priovide consideration(s) of the "Potential(s)" - this week is extreme in its importance.
My intentions are to trade the Micro (15min) Objectives cautiously, not a Buyer, but a Seller.
Buying the expected retracements has been wildly profitable, this too shall pass. We will limit any BTOs
to 1/4 Size and now that we will no longer be able to Hedge SEP/DEC after Rollover, as the March spreads
will be 120+ Ticks wide AND VX is price up Implied VX so the cost of PUTs are now begining to become
less than desirable... the Challenges to Fix any poorly executed enteries - is negligible.
In this type of environment, it is best to move slowly, methodically and observe the Tape. There is no
substitute for Screen Time and observing the Key Periods when the Markets react. We have defined these
times clearly - the "reaction times of day" - they should be well ingrained in those who are consistent
readers of this Forum/Blog/Hub.
Patience will be the best modalility for Trading this week, it will be quite violent. Be quick, book profits
of size when you have them, DO NOT under any circumstances - OVER-Trade. It is temtpting to press Sells
and let profits run when they are growing significantly.
This week will take them away at some point, as the Volailtiy will cut both ways.
We are closely watching the VIX at its upper Boundary of 22.52. As well, the VXN has been very reliable
as an indicator for the NQ.
Financials are a complete mess, we have BANK ranging between 4400 - 4500 and Yields becoming
unsettled as the BOND Buyers missed an important Cross that has been setting up for several weeks.
Bonds Sellers are in control now, Wednesday - Friday will confirm the BOND Markets issues.
The Dollar will re-confirm them.
Be well and Trade Cautiously - HK

NQ - Weekly Downturn Objecitves - Macro CommentsWhere to begin as there are far too many Data Points within the Macros.
Consumer Senitment dropped sharply last month. This is always
a precedent to Downturns, it closed @ 71 for the Month of August.
86/100 years Price has tested the 200SMA
8 Monthly Bull Bars, very low proabability.
9 Monthly Bull Bars, extremely low probability as this has not occured in 60 Years.
Asia has been in turmoil with the US Markets ignoring the signs from China our preferred
vector for disruption after the EU collision.
The Government shutdown can be prevented as the Votes exist, although $4.5 Trillion
in spending is going to face obstacles at a time when benefits continue to expire.
Bonds are, again, acting poorly against the FX Accident we are forecasting for
Currencies - it is frankly difficult to refer to them as such as they no longer are
given their underlying Debt Market creation is evaporating quickly.
The DX is the leader.
Those of you who are/remain regular readers know - My thesis is simple and direct with
respect to Bonds - they will not catch the "Flight to Safety Bid" as they no longer are Safe.
Instead, they will follow the Markets in a "Positive Correlatrion" to the Downside.
Yields will begin to rise again. We see the 10Yr's YCC effort abating short term and
failing intermeidate term.
Housing will suffer a correction, as Credit itself is tightening - All Credit.
The Semiconductor Supply Shortage has been played down imho, it is far more severe
than is being touted.
Q3 EPS will be an unmitigaed diasater for most of the TECH Arena, it will be comical to
observe the excuses mount. Suddenly, very suddenly, it will become REAL.
We see the Producer Price Index far exceeeding the Consumer Price Index by over 100%.
Which implies Producer are NOT passing along the majority of Price Stresses building.
In turn, the implications are HIGHER PRICES ahead, Inflation is NOT ABATING, but
accelerating.
Independent Producers are unable to compete. Most of the Restaruants I frequent have
increased their Prices 30% in a short period of time. This is a wealthy community, on balance
there is a large pool of high income earners who can afford to spend for necessities.
Average incomes among the Professional class in TECH and Services earn $400K+. A
$200 Dinner for 2 is "affordable" and keeps the decreasing number of survivors afloat,
for now.
They are YOLO Prime, it's all about the Dollars.
And speaking of the Dollar, it is tee'd up to rise as the Flight to Safety, Gold will follow
suit as well after it completes it's pattern. Equities, Bonds and Real Estate will all comply
with the Downturn.
There has been a high degree of Bond BTD for months on end, this will come to a decided
end as TLT begins to trade to 139s over the coming several months.
We see a 7, 9 to 13 week correction with the attendant "Flash Crash" panic moment where
Retail exits after the sufferage begins to weigh. This is normal, cyclical and acceptable.
It does not mean the Equities Markets will be cut in one half, we don't believe this based
upon the present projections. Breaking 3588 on the ES would, however, give us pause.
Rather, we see 4/5 completing near and between 200-400SMAs, a good panic Dip-In below
the 200SMA's to provide Fuel for new highs as the FED will, no doubt 10X down on demands
for Powell's follow-on at the FED to "Amp it up" - we call it the "make em gag for it" moment.
That is ahead and quite frankly, Long will be the Trade - imho.
5/5 will complete and that will be the end of the Longest Bull Market in History. It should
conclude in 2022. We shall see as a great deal depends upon how DEBT itself re-appears
under new arrangements Globally.
IS there a Risk we will retest the Highs?
We do not believe so, at least nothing dramatic in terms of a Retracement as they are
being SOLD Wholesale.
The Bond Markets repsonse to the FED will be instrucitve and quite llikley very disappointing
for the Buy the Bond Dip Echo Chamber.
They fail to see their own demise.
It makes a Market, for certain. We'll oppose the Long Bond Trade all day.
1.75% - 2.00% will do it. THE BOND MARKET WILL PRICE IN "INFLATION" - it is this simple.
Time - it's next week or 5 weeks for the real reaction, we believe the shorter end panic
unfolds as the waters continue to grow murky Globally. NExt's week's reaction can be
A large RT or to and through the lows, straight down.
Geopolitical Risks loom large as we have outlined, the ECB is simply done, out of bullets and
facing immense distrust within the EU. France is prepping for Bastille V.2 - the French are
becoming Militant.
CASH ($USD) will continue to be Hoarded, another strike against the Bond Complex. The hoarding
will continue to GROW.
Reverse Repos and US Treasury actions are draining Liquidity and Bond Demand has been met
witin the United States, it is Sovereigns who will see the lasrgets haricuts on their bids.
Repos are going to roll over, again, BOND Negative.
Gold - we see the pattern completing and Gold taking off to new highs. Silver will provide come
clear indications for teh strength of the move and whether the Highs are retested. Deflatioanry
forces will ulitmately have the desired effect for Gold Bugs, we are not there.
The DX can and will cause probems in the short term for GOLD.
The DX will be the flight to safety FIRST, not Gold and certainly not Silver as touted.
The Gold/Silver Gurus - for the 40+ years I have traded it, are always out over their Predition Skis,
not that they are wrong about Economic Conditions... but with respect to Hype, they are always
ahead of themselves for 44 years and counting.
Since 1977, when I began trading/accumulating Physical metals.
The same Sh_t Show... every decade. It is amazing.
On to the the ES...
We have the Death Cross, we have seen rejection take place 3 times.
50 fails, 100 fails, 200 awaits. EMAs have rolled over.
We have a failing wedge into the 1/5 around 4380 - perhaps ahead of the FED.
Wednesday or ahead of it, we would need to see a large Counter-Trend Up o the FED.
Traders need to be on guard... we can bottom out and rallying on Powell's
Meme.
Watch for the lower High for a short term reversal.
4400 to 4370 - this range can provide support SHORT TERM, which ONLY serves to
provide the LOWER LOWS into a FLASH CRASH.
OR
It can simply power down on Bond Yileds blowing up and finally pushing through the
YCC actions to 4100. 3850-3900 is KEY SUPPORT in the weekly timeframe.
We'll know as we approach the follow-thru. For now, keeping an open mind to Price
is best. VX is expanding... 35 - 40 for VIX is our overhead Objective, it can go far higher.
Anything can trade for Price, it can also DUMP far more.
They are attempting to prevent - Straight down.
Crypto - has simply been used as a Dispencery for Illegal Laundering and a large Basket for
Trading.
Regulations will do the rest.

ES - August 4347 - 4542 DrawConsecutive Weekly Bars were 4 Ticks apart, the 2nd being the lower of the two
for September... a Higher High for the ES, by a 7.5 handles.
Tomorrow is "triple witching" and we should anticipate volatility resulting from the
expiration dates of the three financing instruments - stock options, stock index futures
and stock index options all expire simultaneously.
In addition, Derivatives Sqare twice a year @ the BIS - March / September.
The effects are usally quite dramtic and "Max Pain" is unreliable as there are far
larger Pools of Capital squaring.
We are four trading days from the next Federal Reserve pronouncements. Typically we
see the TREND exert itself ahead of the FED. If the do nothing... or pander the same
- then it will be October, that won't work for most... not at all as Q3 Earnings are
going to be - horrific - and everyone within the Complex knows this.
We are yet to hear actual warnings, instead we see teh Media edge off "issues" and
"severe Issues" with Semiconductors.... Not Black GOLD, but Arrangement GOLD.
It won't pass, buggy whips included.
Sellers remain and loom quite large, Retail was squeezed once again today as Futures,
Put options and Shares were sold into during the prior several lows below 4441.
Friday's are always a low liquidity session - with one expcetion, 3x ad 4x expirations.
Usually the expanding range counter-trends last from 3 to 7 trading days.
Gap Fills are axiomatic as we move from Monday to Friday as the probability increases
as we move throught the week.
More than a few traders are wondering if we off to far higher levels.
We had solid strucutre counts on the YM RTY ES and even the NQ although it was the
laggard. These counts respectively 8/9 - 8/9 - 6/9 and 4/9 have reversed.
We now see the range expand as indicated by the VIX / VVIX / VXN - as vol of vol began
to fall shaprly we has our signals the trade would reverse, this was yesterday.
It will be difficult for Price to move to close over last months high indicated in the chart
above. It may get close, but it will take a monumental effort as Institutions are in a
very clear pattern of SELLS, they abated as there were no buyers, even the Retail Dip
buyer tossed in the towel.
The same Dip Buyer is now looking for 16, 17 , 18K for NQ - 5000 for the ES and 2400 for RTY
as well as 37K for the Dow after this reversal - and to be fair, for well over a year they have
been 100% correct.
It was not until last September 3rd we had a sharp correction unimpeded.
It has well beyond one year Price has tested it's 200SMA.
We can how the defense came in looking at the 1 Hour Chart - the Death Cross was not to be permitted.
Quite often, reactions from the 100SMA 1Hr are violent as it is THE LIS for Professional Managers.
No one wants this game to end when the Taxpayer is funding enormous Profits, No One.
The issue is it cannot contniue given the Global Backdrop and the longer it does, the more severe the
Drop.
We do not believe it will fall more than 10 -15% - perhpas dipping in to 400SMA Dailies, but not exceeding
3588 as the 1/5 conclusion, this would imply a larger, perhpas 30 - 50 % correction, one that is not
recoverable for a long time.
There is price where it squares, we are approaching it. Sellers moved Price out of their own balance as they
have more to distribute.
The only real hedge they have left is Volatilty Instruments, these are worthy of following very closely to
determine when and where they have comfort in beyond Delta Nuetral for downside Profits, they
continue to build these positions as VX declines and Protection decreases in Price along with Vol of Vol
or the VVIX Instrument.
Know what to look for as we move through this period.
It can and wil change very quickly, we firmly believe 200SMAs will be tested into October/November
and would suggest the 400SMAs stand a higher probability of being an Objective.
We believe 4509 - yeah, that's going to be a very tough Close EOD.
It should be SOLD wholesale.

VIX - OCT / VIX & VXNFrankly this is all we need to watch, the VIX
has consistently been Bid into Settlement only
to fall back to LT Support.
Will we retest the Highs or come up short and continue
the Institutional SELLs.
ES - 4451.50 is the Support Level for ES / 3493 - 3498 - 3509 - 3512 - 3521
YM - 34527 Pivot / 34994 Objective
NQ - 15388 Pivot for higher and Micro Support
We are SOH until 10 AM EST and watching how Macro Data impacts Price levels.
It will be all quiet until the FED next Wednesday.
The buyers strike was filled on the Squeeze, is there Fuel left?
We shall see.
DX - DX/JPY - Yields indicate Risk Off remain in trade.
Flip a Coin, it will depend on BR / VG / FED and Inst's sitting on Hands for higher
levels.
*** Our bias remains R I S K OFF at levels for reversals.

VIX - Potential for an Index Squeeze is building - CautionToday will determine as to whether this SELL takes a breather and provides
a large retracement for the ES YM RTY and NQ
OR Continues
Buyers are on Strike, Sellers need to be the new Buyers.
VIX Settlement is today - Price has a Gap to Fill Below.
We will be waiting for the Range within the Micros and larger Daily
Timeframes to resolve prior to entereing.
_______________________________________________________________
FED annouced new Coupon Purchase Schedule and we see there is
Support once again.
SOH Until NYSE open and 10AM Inst Open.
Prosperous trading - HK

NQ - CPI / Yields + ES YM RTY - Structure SummaryIntra-Day setups remain our only trades as the VIX completes Settlement Tomorrow.
Puts are again becoming attractive as this weeks Gamma Squeeze is beginning to
become extended.
AAPL -150 CALLS * Apple claims they will be unaffected by Semi Shortages
TSLA - 750 Calls
AMC - 56 Calls
______________________________________________________________________________________
20 Weeks SemiConductor lead times.
Q3 EPS warings begin next week
VXN Pullback
ZN broke the Long we are watching the 133.125 Level
TLT weakening in structure sub 150
***12735 is the Longer Term Price Objective into November
______________________________________________________________________________________
ES YM RTY remain in a Micro Squeeze on VIX Settle and pullback potential to 19.20
ES - remains within its Series, Resisitance is holding for now, the Objective is a full 50%
retracement off the conter-trend long from lows.
ES PO - Larger Resistance 4492 - 4505
YM - 34993 -35035 Objective
RTY - Ranging between 2119 - 2335
______________________________________________________________________________________
CL - 7161 breaks and we have the potential to return to the Weekly FHWB @ 77.00
CPI will have a large effect upon CL
Previous highs acting as support... mean higher for now.
______________________________________________________________________________________
Food Prices rose 16% MOM... CPI Ex - Food/Energy
Energy Prices are up significantly MOM
Dollar / JPY is gaining strenght implies a clear flight to Safety and RISK OFF
109.83 sends it higher... far higher.
10Yr Yields remain just below a breakout at 1.417
Financials have failed at resitance repeatedly - 4521 the level of Micro Resistance
______________________________________________________________________________________
The FED removes theor gloves next week ahead of important elections. Namely It Canada intially
as Treadeau is the Chimp to watch for the Green Agenda in North America... it is extreme in its
importance for the Agenda.
Europes selections will be followed closely as well as LaGarde has teed up her Chimps to advance
the Agenda.
California has the Governors recall which appear to be failing quietly. Gavin is a piece of work, little
HItler disguised as a Sunbeam.
______________________________________________________________________________________
Geopolitics will have far more impact than has been priced in...

NQ - Fridays / ES YM RTY TLT ZN AMC TQQQ CLNQ is the last to break.
It's Friday.
The FED is providing $8.34 Billion in Coupon Purchases.
1/4 to 1/2 Size today.
We will be watching until 10AM EST, to see IF there is
support of any kind.
Selling pressure yesterday was significant, but
again... it's Friday.
Commentary from 2 prior Sessions does not change.
Have a good weekend - HK

YM - BackfillingIndustrials taking a break from the Selling to gain
higher entry Fills.
Trend remains South.
As VIX and VXN pullback into ROLL/Settlement
from M1 into M2, Price is completing the next series.

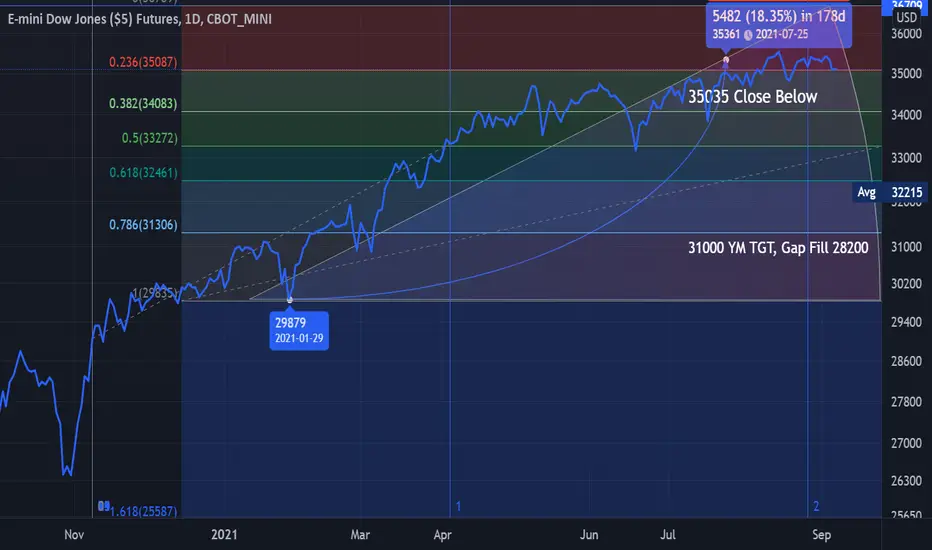
YM - Weakening in Defense @ 35035Industrials continue to follow Transports.
Energy, Materials, Every Sector weakening.
Dow 31K Target as Yields ROC's gain further traction.
Terrible Breadth.
US DX continues to build into the FX Accident.
NQ - Micro TFAs the VXN and VIX are targeting Higher...
The Indices will continue to struggle.
YM has not closed below 35035
NQ has not closed below 15526
ES has not closed below 4441

YM - One Hot Mess, 35035 Closing fails and it will plungeThe Transports continue to Provide indications the DOW/INDU is
heading for a 31K target into October.
Decidedly weakening.
Utilities aren't even catching a Bid.
The Russell 2000 holding up remarkably well in the face of
selling.
RTY Plaything remains just that for now, a place BR/VG can
park $ and prop... for now.

YM - Monthly Close > 35035 for August LIS / SEP VX +++The Risk of a 2 month correction after this week completes and treading begins Tuesday.
This does not appear to be a major high and a retest of support back to the 31,000 level
is possible as long as 37,000 level on the Dow is not exceeded.
Wide Range? Indeed - 2,000+ Ticks of range.
Yes, it all is within the boundaries of enormous Ranges, trade Micro CT's in INV Ladders
as opposed to going all in at a specific level.
ALL order flow is bought and sold, everywhere to varying degrees.
When it is raining SELLs, the fuel remains for a Squeeze.
We are anticipating a SELL this week in ALL Equities, we'll see where they game
it too... prior to dipping back into the SELLER Deep End of the Pool.
Overall, we are Bias to downside, patiently waiting for signals that will arrive all too
quickly.
Transport look weak... DX will provide cover early in the week, Yields not so much...
Blink and you'll miss it - imho.
- HK

VIX - 2 Tick Front Run of Gap FillCaution warranted on Buy Side as VIX is competing the Lower Boundary
Target ahead of the NYSE open.
The probability for an Intra-Day reversal is building ahead of RTH.
We are buyers of the 18.40 level and below.
YM weakest Instrument at present.
Our Trade Plan is now within parameters for SELL entries.

dow has trendline resistance it could break.all markets are trying to climb out of the hole this morning. they could do it, but with a selloff fresh in our memories, it is very hard to be a buyer, knowing that at any point the sellers could regain their confidence and try dropping it again.
From a risk management standpoint this lowers the probability of finding a stop loss in a protected area. with the threat of bears in the air, there essentially isn't a protected area, which means you can probably only rely on pattern breakouts, which I'm not really seeing much of. They have been forming, but they haven't initiated big volatile moves like you would see when a market has clearly picked a direction.

ES - Channel Surfing 2hr - NQ YM RTY SOXS TQQQ TLT ZN ZB ARKKFriday's WRR was symptomatic of how the Order Book and Market @ depth can be
rung like a Bell - Every stop was smoked.
We held 493s @ 12 after peeling off the same ahead of Thursday. A solid and comfortable
buffer of 8 Handles giving us a 501 B/E - Stop was 96, the reaction level and prior PO.
Wrecked in minutes, All positions took the poker, hot.
NQ was the leader into Thursday close, making a lower low on the Hourly, while finishing
Friday @ new ATHs. The only trade taken in NQ was the initial higher high @ 428 to 390 on
80 MNQ scaled in from 426. This Sell became the fuel for the next stop run higher. Retail
Traders entered and reentered the Sell all day only to be crushed under the Futures bid.
The Semis bid took SOXS to new lows, ending our position on Stop - our largest loser in
17 months.
TQQQ stopped .38 below entry. TLT ZN ZB closed @ 0.12%+ ARKK Stopped at ~ Entry and on
and on it goes... stop stop stop run. 1st losing day in 17 days and a large loss on SMH's.
______________________________________________________________________________
ES Chart illustrates the higher targets - and lower 4441/4444 Support - 80 Handle range.
What it does not show is the following - Market on Close orders were followed on in
Globex - the Sell imbalances... were immense.
Perhaps those in the know, knew the Drone Strike retaliation was on Deck.
It is clear we are in a Large topping process, with stop run after stop run the tool in trade.
Where this terminates now is a WAG.
The very moment everything lines up in a large SELL, the rescue operation doubles down
and makes New ATHs on expanding divergences.
Frustrating in the extreme as it requires very large drawdowns, unacceptable drawdowns
on Capital.
Hedging DEC SELLs with SEP Bids Intra-Day has worked, although the Risks in continuing this
balance is so extreme, we are going to remain in CASH with an extreme negative position
structure.

NQ - Equity Analysis, Macro Events - Friday Powell 10AM ESTNQ and the Balance of Equity Instruments traded to resistance overnight ahead
of Today's Macro Data and Fed Chair Powell speaking @ 10:00 AM EST.
Kaplan's expected reversal of reversal Taper, came and went.
Bullard was extremely Hawkish yesterday.
IF Powell is less so, the DX will decline.
Financials remain in SELL. Bonds remains in a SELL.
ROCs in 10Yr need to be watched carefully.
VIX inside the Long from lows with all pullbacks defended - 18.95 LIS.
FRYday's are usually "VIX Attack".
Support for VIX M1 @ 19.65.
ES remains in a Larger Long, it defended the .382 with the Gap Fill @ 4466.65.
YM is the Weak Sister, it defends Globex resistance.
RTY has yet to trade a Pull Back.
The usual suspects - AMC TSLA ARKK do not look good... it is OPEX.
Gamma failing for the 4th week in a row.
Participation will roll off after 11:30 AM EST as EU Session closes.
BR/VG will be on the hunt... Friday's are theirs's.
We are taking today off from trading on balance with 1/4 to 1/2 size today
at maximum.
Next week will provide the continuation to advancing the SELL, we began positioning
for it this week. 38% Sell to Open presently DEC on Derivs and M1 - M3 Vix Complex.
Today's Price action will be aggressive if the usual suspects show up to run Prices.
We will simply Hedge DEC with SEP CTs if necessary.
10AM will obviously provide a reaction, we are SOH til then.
For today, we are Neutral and trading very small size, limiting risk exposure.

VIX - VJH / Financials / Bonds / Velocity / Scope / ScaleGood Morning - Hope this finds everyone well.
The Virtual Jackson Hole Symposium begins a 3 day affair today.
_______________________________________________________________________
Bonds
Macro Data includes Preliminary GDP and Unemployment Claims @ 8:30AM EST.
Economic Calendar - www.investing.com
Bonds out the Curve 10Yr (ZN) - 20Yr (TLT) - 30Yr (ZB) have been pulling back. As we indicated in prior
commentary, the ROC (Rate of Change) is seeing increasing Velocity ahead of VJH.
The 10Yr is the weakest Instrument.
Volatility in Bonds, we anticipate will begin to Increase.
Bonds have been the Deposit of Choice, regardless of Real Returns - the Return of
Capital as opposed to the return on Capital - this speak volumes as to what is coming.
An assured loss in Bonds is axiomatic as Inflation remains well above Real Returns
adjusted well beyond the CPI/PII inaccuracy.
_______________________________________________________________________
Financials
Traditionally, Financials respond well to Positive Rate Adjustments.
In prior Macro Observations, we Indicated some time ago, Banks were no longer lending. We began to
Observe Banks reducing Lines of Credit (LOCs) and Revolving Credit.
Reverse Repurchase Agreements began a change in Term Structure early in 2021, with longer
dated terms out to 48 Days, some further duration.
As Economic activity is grinding down, Banks were exposed to increased Deposits.
Liabilities, which they began to shun, driving increases in Money Markets, which have become
Bloated. This is reminiscent of when the Dollar Broke Par during the 2006-2008 Financial Crisis.
This one event spooked the Markets, it set off a large Panic. It was not until Janet Yellen and
Timothy Geithner arranged for $2 Trillion in Short Dated Treasuries to be authorized, did the
DX crisis abate.
The Dollar is being hoarded as Fear continues to compound. It is the Senior and Reserve Currency
and during crisis, remains the preferred Position.
The thinking is simple - Why give the Government my Money as it is assured a loss, the Debt can
never be paid back.
It can be paid back synthetically - a Tomato would be $1,400.00.
_______________________________________________________________________
Volatility
Events - Important Events to Market Participants, speed up Market Activity.
It expands the Scope and Scale of participation, while having a large and profound effect
upon the speed of Trading Activity.
Prices become extreme in Intra-Day actions.
Yesterday, we observed a large Bid under the Front Month M1 @ the 19.00 level. Protection
was being Bid there.
During Globex, we saw 18.95 trade, a one tick dip below, this is quite typical as the VX
always trades a one Tick move above or below when it is staging.
And it is... the Falling Wedge on the Daily has provided 7 Months of Wash Rinse Repeat declines
programmed to perfection.
The larger Daily Targets for the VIX M1 extend to the 12s.
The problem is, they haven't traded below 16...
All eyes should be on Volatility as it begins to pick up.
As many of you know we have a large VX Position - VXX, VX Curve, VXM, we will continue to
build this position into September.
We anticipated a Break of Trend for the Globex Tuesday night session. It failed to materialize
as Distribution is incomplete, but very close to ending.
Last night's GLOBEX Session was a clue, we saw indecision.
We are watching the VIX M1 Front Month @ 10:00AM EST for 19.65 as the level to indicate the
VIX Curve will be breaking up and out.
To be clear, this is NOT the Cash/Spot VIX - the Instrument is the Front Month Futures Contract.
________________________________________________________________________________
Our Position Sells are weighted heavily in TECH and VOLATILITY.
We anticipate at least an 11% Correction form the most recent ATHs.
It is developing, albeit slowly... this is about to change IMHO.
BE well, Happy Hunting.
- HK
_______________________________________________________________________

ES - Look out below96s were our 2nd entry, Tech will lead the declines.
Broad Market Selloff today as Dippers have left the arena.
Expecting 500 to be yanked out from under NQ this week.

dow. 2 hour. sideways across the board in first 30 minutes.all of the indeces are trapped in a range for the first 30 minutes of trading. if you took any positions this morning you probably lost money. Might be a good day to sit on your hands, but if there is a breakout we could do some trending later on.

NQ - Building December SELLs NQ ES RTY YM - First EntriesMNQ STO - 10 x 15365
MNQ STO - 5 x 15360
MNQ STO - 5 x 15355
MNQ STO - 5 x 15350
EQ - 2.5 NQ Sells
After Kaplans later Friday reversal, the die was cast for the cartoonish over throw.
Our Initial Target from 3 weeks ago was 15363, this target was met and exceeded
in the NQ SEP CT @ 15384.
We will continue to use SEP as the BTO Hedge, we closed 2 NQ from 170 break
at 322. We hold Zero SEP Hedge for NQ currently.
We remain in a large Bid for SOXS, with 28K @ 6.91~
ES -STO 6.5K CTs
RTY - 0 Positions
YM - 0 Positions
CL - STO 7K 65.87
VXX - BTO 6 CTs 2644
VX - M1/M2/M3 BTO 8 CTs on Curve
VXM - M1 40MCTs
SOXS - 28K ~ 6.912
___________________________________________________________________________
The VIX Curve implies an 86% chance of increased Volatility for the Indices today.
Extremes in many metrics and indicators, keep us in a Line Feed Out strategy for a violent
reversal.
The Monthly patterns, imho - are completing off two historic conditions:
1. A break away monthly Gap - never occurred in History, never.
2. 7 Monthly Bull Bars probability is 12:1 against. An 8th has never occurred in the past 25 Years.
Market breadth is extreme in its weakness.
Gamma was once again the driver, with vastly reduced Call Volumes.
AAPL TSLA GOOG NVDA - another attempt at GS will fail imho
AMC Apes bought the 39s... we are seller of AMC from 37.50 to 41.00
TSLA - Sellers at 720 - 750
ARKK - Sellers 120.11 to 125
WE Anticipate a violent reversal very soon. Ideally, today should close Negative no later than Globex.
Prosperity to those positioned for the reversal.
- HK

ES - Monthly Terminations over the past 25 YearsThe throw over continues to imbue the Bulls who see Big Green Bars
to chase.
And why not?
It works consistently, the FED has your back.
Until it decides "Extremely Elevated Equities" need a solid trim.
Our indications of a throw over last week have played out perfectly.
After Distribution, Market Makers are permitted to extract their exit
and pound of flesh, it happens over and over and over.
The party is coming to a decided end for the Shorter Term.
Chase Bars or slowly feed out your lines.
We are feeding out lines.
- HK
