YM1! - Dow Futures Weekly Analysis, 7/11/22The TEAL descending channel structure was able to support selling pressures last week.
Resistance above, BOTH the BLACK and ORANGE would need to be overtaken for this market to grind higher.
Support and Resistance structures have been adjusted for your reference this upcoming week.
Wishing you a blessed and profitable week!
YM1

US30USD YM1! DOW 2022 JULY 11 Week
US30USD YM1! DOW 2022 JULY 11 Week
Last week, rotation support long was good. 3 TF analysis is displaying weakness.
We should be expecting lower prices temporarily.
I'm keeping the existing scenario plan from last week.
Possible scenarios:
1) Channel resistance / rotational resistance = short
2) Market rotation = trade at boundary of range
3) Behavior change senario
4) Trend continuation - channel boundary trades
Price reaction levels
Short on Test and Reject | Long on Test and Accept
32563 31867
30406 29639 26212
Weekly: Low volume up bar close off high = minor weakness
Daily: Ave vol up bar close toward low = weakness
H4: Very high vol up bar close off high toward middle + level close in background
= weakness
Remember to like and follow if you find this useful.
Have a profitable week ahead.

DowJones Targeting The Equality Objective @32500In this update we review the recent price action in the DowJones futures contract and identify the next high probability trading opportunity and price objectives to target

YM H4wait until the support line breaks
In this update, we review the recent price action in the Dow Jones futures contract and identify the next high-probability trading opportunities and price objectives to target

DowJones Bullish & Bearish Pivots In PlayIn this update we review the recent price action in in the Dow Jones futures contract and identify the next high probability trading opportunities and price objectives to target

E-MINI DOW JONES ($5) FUTURESA very strong descent and now we are seeing a strong correction and then we may see a strong movement and we need patience and we are likely to get a strong and fast landing if the lower demand area breaks.

US30USD YM1! DOW 2022 JULY 04 Week
US30USD YM1! DOW 2022 JULY 04 Week
Scenario1 short last week was good.
Market did not reach bottom of channel, temporary return of strength
Possible scenarios:
1) Channel resistance = short
2) Market rotation = trade at boundary of range
3) Behavior change senario
4) Trend continuation - channel boundary trades
Price reaction levels
Short on Test and Reject | Long on Test and Accept
32563 31867
30406 29639 26212
Weekly: Ave volume down bar close in middle = indecisive
Daily: Ave vol up bar close at high = minor strength
H4: Ave vol up bar close off high = weakness
Remember to like and follow if you find this useful.
Have a profitable week ahead.

YM1! - Weekly Market Update, 7/5/22Index Futures traded rangebound this past week, locked between support and resistance.
No actionable ideas at this time, while the bias remains to the short side.
I've adjusted support and resistance structures accordingly for your review.

YM1! Short PositionAccording to my strategy YM1! will encounter following scenario in Bearish market:
Sell Limit 1: 32350
Sell Limit 2: 32500
Sell Limit 3: 32900
Tp1: 31250
Tp2: 30175
Tp3: 29700
SL: 33400
R/R: 7
You Can make profitable trades only if you be careful about your MONEY MANAGEMENT Strategy
Patience is the key of making money.

US30USD YM1! DOW 2022 JUNE 27 Week
US30USD YM1! DOW 2022 JUNE 27 Week
Scenario2 channel & 29639 support provided long opportunity last week.
Daily TF cautioned of possible trap for long. If Weekly TF reveral pattern is to exert
influence, would prefer then a long on retracement when price finds support at
lower levels.
Possible scenarios:
1) Channel resistance + test of previous breakdown area - will short if resisted
2) test of 30683 / 30100 and if supported = long.
Price reaction levels
Short on Test and Reject | Long on Test and Accept
32563 31299 30999
30157 29639 26212
Weekly: Ave vol up bar close at high = minor strength (and reversal pattern)
Daily: Low vol up bar close at high = Caution, may be trap for long
H4: Ave vol up bar close off high = weakness
Remember to like and follow if you find this useful.
Have a profitable week ahead.

Failed Breakout, Back Into RangeThe S&P stuck its neck above last week's FOMC gap settlement and the SPY had a bullish engulfing daily candle, but all was surrendered ahead of the close. These are some of the indicator we are looking at to signal this pop in stocks can turn into a real rebound.

Dow Jones Trading The CorrectionIn this update we review the recent price action in the Dow Jones futures contract and identify the next high probability trading opportunity and price objectives to target

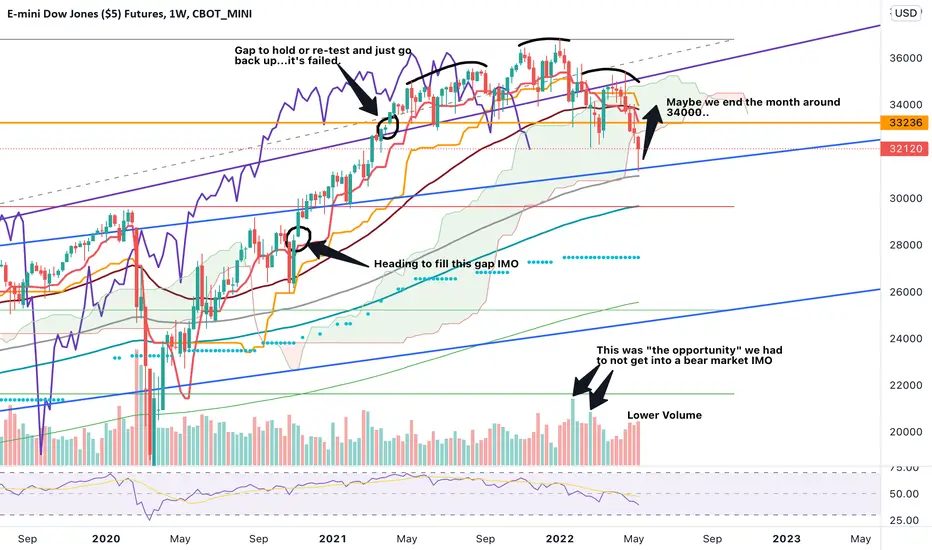
We can't go anywhere without the DOWI was a bullish hopeful at the start of the week...I was thinking we would fill the 4K gap on the ES and then just go. Instead we spent 4 days closing below this figure. Yes, we closed the week above it and kept the lagging span just above the cloud but we cannot go anywhere with the DOW and this chart says it all. Neckline is clearly broken. Now, I do think we could have a minor rally to end May with a possible green monthly candle.
The charts are clearly broken and will have limited re-tracements IMO.
The NQ & RTY are in bear markets, enough said there.
Sell the rip....
YM1! - Weekly Market Update, 6/20/22Dow Futures have triggered a short opportunity based upon last week's price settlement. I've detailed my ideal entry, stop loss and targeted areas on the chart.
I've also updated support and resistance structures for your reference. Wishing you a blessed and profitable week ahead!

US30USD YM1! DOW 2022 JUNE 20 Week
US30USD YM1! DOW 2022 JUNE 20 Week
Last week shorts reigned. The week ended with demand coming in to support the market.
We may see long opportunity near 29639 temporarily.
Else, wait for price reaction to 29639.
Possible scenarios considered are:
1) 29639 support fail for short continuation
2) Channel and 29639 support: Return of demand for temporary long opportunity
3) If market retrace on low volume to higher levels and is rejected = short
Price reaction levels
Short on Test and Reject | Long on Test and Accept
32563 31299 30999
30157 29639 26212
Weekly: High vol wide spread down bar close off low = demand has come in.
Daily: High vol down bar, narrower spread and closing off low = strength - demand has come in
H4: Last 2 bars combined = UHV down bar closing in middle = Demand present
Remember to like and follow if you find this useful.
Have a profitable week ahead.

SPY/SPX/ES/MES Elliot Wave AnalysisLooks like a big rally shaping up to end the month of May, but June should be a full-on bear fest, at least to start the month. Major Wave 1 down should end in the 3200 - 3500 zone. Likely, we'll rebound from there into the Fall of 2022.
Major Wave 3 will likely project down to the 1500 zone. Major Wave 5 will likely end in late Spring 2023 with target projections somewhere between 1500 - 1200 with a very real possibility of undercutting the 2009 low @ 666.
If we do undercut 666, supercycle Wave 5 up should begin, lasting 8.6 years into 2032 and reaching 50k to 100k + on the Dow Industrials. After that, it's possible the whole thing drops to zero and the shithouse goes up in flames.
Credit to Dan E. for his wave analysis and Elliot Wave International CME_MINI:ES1!
Side note - When things get super volatile, I like to trade the mini ES. Trades great with excellent liquidity.

Dow daily say : fibo 161% say dow can crash to 29000above green arrow (next posible low place) when pinbar on 1hour , 4haur or daily chart come , we must pick buy ok? but with SL in pinbar low understand ? for hold to high
if clear buy pinbar verfy not come , wait more , dont pick buy
if pinbar comes , dont fear pick buy but very low size , dont close it soon,after 80 point move SL to open price , let it go upper ,try hold it until 34000 area (can take 10 day)
personaly i think 29500(2nd green arrow) is 2022 low , then dow will start big +up trend to high
good luck , if you have old buys in witout SL you are in danger ,dow can go downer in coming hour ,for help contact my Telgram :ramin_trader2006

YM1! time to buyafter the downtrend that we had we will see a big movement of an uptrend we can take the buy position after the confirmation of the range breakout

YM1! - Weekly Market Update, 6/13/22YM weekly analysis has been updated for your review, the market has broken down with confirmation however we're approaching very close support.

US30USD YM1! DOW 2022 JUNE 13 Week
US30USD YM1! DOW 2022 JUNE 13 Week
Last week we see a Scenario1 Rotation followed by Scenario3.
Market descended on strong volume, very nice short.
Possible scenarios considered are:
1) Market continue to be in rotation between 33205-32500
= Wait
2)32728 becomes support
3) 32728 becomes rejected and market return to test
30584-30926
Price reaction levels
Short on Test and Reject | Long on Test and Accept
36446 35750 35330
34807 34027 33531
33205 32563
31411 30926 30584
Weekly: Ave vol down bar close at low = Supply remains
Daily: Ave vol down bar closing toward low = Supply remains
H4: Ave vol down bar closing off low = some demand present
Remember to like and follow if you find this useful.
Have a profitable week ahead.

Dow Jones: Jack-in-the-boxOr in fact: Jones-in-the-box as Dow Jones has jumped out of the lower green zone between 32374 and 32934 points quite impulsively. Although the index could now directly continue the ascent above the resistance at 33434 points, we rather expect it to come back into the lower green zone to finish wave 4 in green – ideally at its bottom. Afterwards, Dow Jones should rise above the resistance at 33434 points and further upwards into the upper green zone between 34311 and 34823 points to complete wave 5 in green. As soon as the index has accomplished this, it should start a countermovement.

YM1! Time to sell after the end of the uptrend we will see a downtrend after having a big sprint box sign

US30USD YM1! DOW 2022 JUNE 06 Week
US30USD YM1! DOW 2022 JUNE 06 Week
Last week market was in rotation between 33205-32500.
No resolution between Bulls/Bears yet.
Hopefully early week big operators will show their hand.
Possible scenarios considered are:
1) Market continue to be in rotation between 33205-32500
= Wait
2)32728 becomes support
3) 32728 becomes rejected and market return to test
30584-30926
Price reaction levels
Short on Test and Reject | Long on Test and Accept
36446 35750 35330
34807 34027 33531
33205 32728 31979
31411 30926 30584
Weekly: Low vol down bar close off low = minor strength
Daily: Ave vol down bar closing at low = minor weakness
H4: Ave vol down bar closing level with previous UHV bar =
minor strength
Remember to like and follow if you find this useful.
Have a profitable week ahead.
