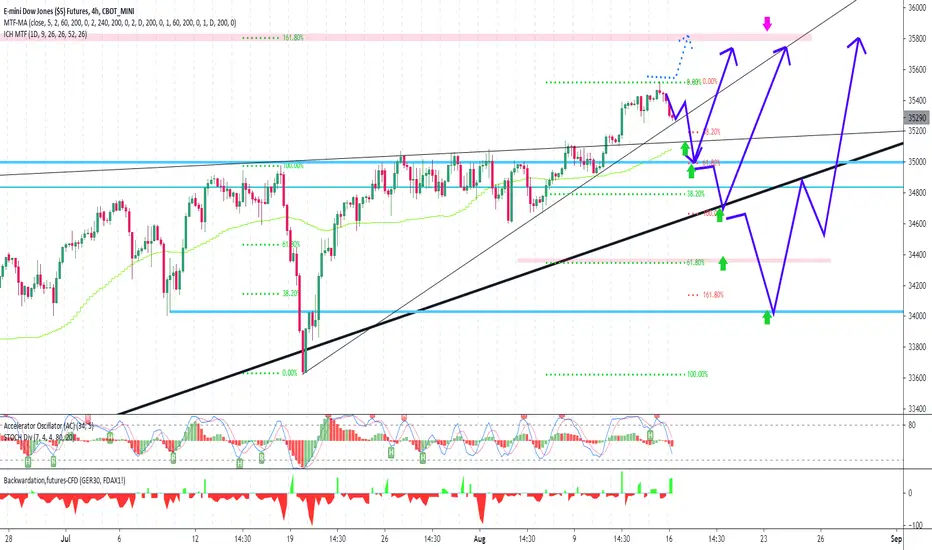
16 August: powerfull buy limit place you must put china news comes very bad , this mean we will see down trend
www.forexfactory.com
most important green arrow ,buylimit place is above 35000 and 34000
after green arrow buy open,hold them 10 day to 35800
all sl=80 trailstop=80(after sl move to open price ,disable trail stop,let go up)
ALERT=IN LONGTERM DOW GOING TO 40.000,FOR THIS WE DONT ADVICE SELL ,99% LOOKING FOR BUY IN DEEP
YM1
US30USD YM1! Dow 2021 Aug 16 WeekYM1!
US30USD YM1! Dow 2021 Aug 16 Week
Weekly: Ultra Wide Spread High Volume bar close off high = Weakness
Daily: Upthrust, close lower third of bar = weakness
H3: Shortening of Thrust, Upthrust
H1: Shortening of Thrust, Upthrust, diminished bullish volume
Strategy for Long (test and supported)
1) 35220 - 35268
2) 35165
3) 35000
Strategy for Short (test and rejected)
1) 35520
2) 35438
3) 35388
Remember to like and follow if you find this useful.
Have a profitable trading week ahead.

E-mini Dow YM1! 2021 Aug 09 Week
YM1!
E-mini Dow YM1! 2021 Aug 09 Week
Monthly - Ultra Low Volume, Ultra Tiny Up Bar = may usher in Change in Behavior (takes time)
Weekly = High Volume with Narrow Spread = Weakness, net progress from previous week's high = narrow = Weakness
(Note, no change in behavior yet)
Daily = High Volume Up bar Close off High (Weakness, keep stops tight)
H4 = 2 H4 bar closing level (market may pause / rotate)
Strategy for Long:
Long if 35137 holds / 34949 is tested and holds
Strategy for Short:
If price rejected at recent high 35137, or returns to 35072 and rejected = short opportunity
Remember to Like and Follow if you find this useful.
Have a profitable trading week.

Market overview mid-week update - Week 30At the moment the big question is whether the market is taking a breather, and will continue to go up? Or is it topping out and will we have a correction to the downside soon?
I can find a arguments for both, so I think we need to just sit on our hands and wait till the market unveil their intensions.
S&P 500 (ES mini future):
Sofar the market action is panning out as expected (see See Market Outlook - week 30). not much action and forming a reversal candle.
At the moment the weekly low is 4364.75 and if we are not going below that this week and also not very far above the current weekly high of 4416.75 one could consider going short next week on a break below 4364.
Also the daily chart is not giving much information it's a sideways movement where intra-day losses, are retraced for the most part.
Nasdaq 100 (ES mini future):
Actually it's the same picture as the S&P mini futures on the weekly and if we close the week at around these levels, then next week a short may be possible when trading below current weeks low.
Looking at the daily chart, it offers a little bit more clarity than the S&P daily chart, because on Monday an attempt was made to break the 20 day MA and was nicely rejected on a rebound on Tuesday. This might even suggest that the 1-4 candle correction (b/c MRI sell) on the weekly is already dealt with.
But as long as we have not crossed the break-out line I'm not willing to call that yet.
Dow Jones Industrial (ES mini future):
It's getting boring but there is also not much difference here from Nasdaq and S&P. But since there was a starred candle last week, one could consider a long at this point, but looking at all the other indices discussed here I myself am not willing to that.
Also the daily is not able to shed light on the situation and is moving sideways.
Russell 2000 (ES mini):
The Russell was a bit of a trouble child at the start of the week, but it is still holding the trendline drawn from last year's March lows. But as long as we are below the 20 weeks MA I don't really see a long opportunity here.
And as with all the other indices nothing to tell really about the daily chart as well.
As always, this is not trading advice, but only my views on the market.
Please do your own research before entering any trade.
Happy trading

Futures Levels | Look Ahead For The Week of Jul 18Stock indices finally broke their uptrends last week, and the small caps (RTYU2021) completely fell apart. In the first of what may become a Sunday evening series, I take a look at what the Volume Profile and price structure may be telling us in terms of levels to watch this week for the ESU2021, NQU2021, RTYU2021, GCQ2021, ZNU2021, ZBU2021, and MBTN2021.
Quick take away is my favorite idea is to fade the strength in notes and bonds looking for rates to bottom in this cycle.

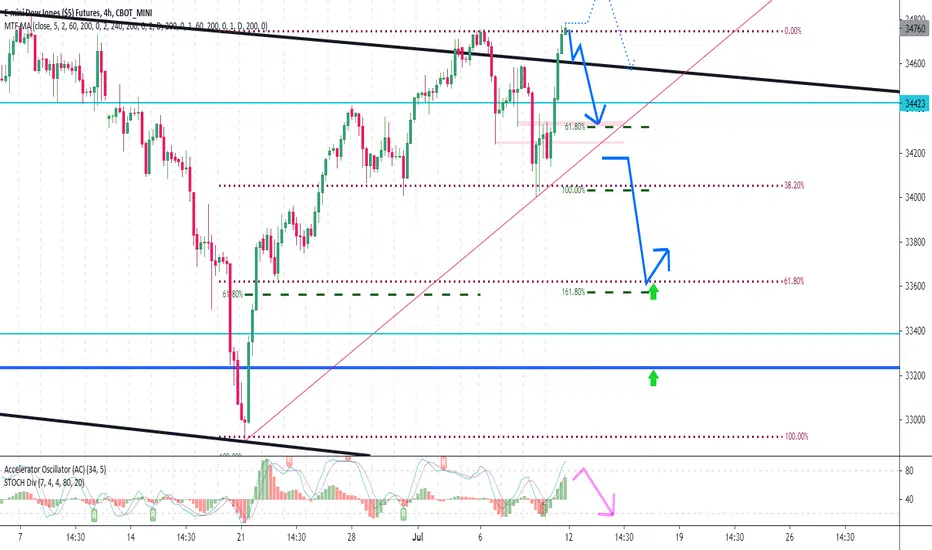
stochastic and AC go to sell on dow why sell? on CASH PHISICAL DOW NYSE we have big ,powerful open gap in down
in other side see AC and stoch on 4hour chart , for coming monday to wednesday dow must see min fibo extention (projection) 61% (predict= wide zigzag days will comes)
alert= if dow break red trendline can crash
advice =looking for buy on above green arrow specialy 33600 is powwrful place for buy and hold
for fair analyse ,i dont have any open order on dow (i am dax trader from 2006, on real money i only trade dax ,however i monitor dow from frist days )
good luck , dont forget use lowest size and put sl on low/high (or 80 point)
SP500 – Real or False Breakout?SP500 finished another record-setting week. The rally comes as bulls seem to be growing more comfortable with the Fed taking its foot off the gas sooner than Wall Street had been anticipating. Bulls still want to focus on booming growth expectations for the second half of the year as the pandemic recedes and economic activity accelerates.
Fundamental analysis
However, the inflation story is growing harder to look past and there are widespread expectations that analysts will begin to trim some of their lofty second quarter earnings forecasts as a result. Earnings for S&P 500 companies are currently expected to increase +60% in Q2. Lingering impacts from the pandemic that have roiled supply chains and disrupted the flow of goods don’t appear to be clearing as quickly as most had hoped, which is going to inevitably have an impact on many companies’ bottom lines.
In fact, “inflation” was mentioned by 197 of S&P 500 companies during first quarter earnings calls, the highest number in at least a decade, according to FactSet. Over the course of the past decade, U.S. inflation averaged just +1.8%, versus the Fed’s +2% target rate. Not surprisingly, Bank of England last week left its monetary policy unchanged and brushed aside fears that inflation was running out of control.
The rate-setting committee echoed statements similar to the U.S. Fed, saying they expected inflation would be “transitory” and that scaling back support too soon runs the risk of disrupting the economic recovery.
Data to watch
Next week will flip the calendar from June to July on Thursday, which also marks the end of Q2 2021. The June Employment Situation is next week’s key economic report with around +500,000 to +600,000 jobs expected to be added. The May gain of +559,000 was lower than anticipated, though March and April gains were revised upward.
Other data next week includes the S&P Case-Shiller Home Price Index and Consumer Confidence on Tuesday; ADP’s Employment Change, Chicago PMI, and Pending Home Sales on Wednesday; the ISM Manufacturing Index and Construction Spending on Thursday; and the Trade Balance and Factory Orders on Friday.
SP500 technical analysis
SP500 closed the week above the upper range of resistance. The major economic indicators are still bullish. What worries me now is Advanced Decline Line. It showed weakness last week and formed bearish divergence. Moreover, the yield curve is flattering. It is not a warning sign yet. But still, traders have to pay attention to it.
In general, if price sustains can current highs, we can see a run towards 4400. The cycles forecast a rally at the beginning of July. So, let’s see how it plays. The important supports are still MA50 on a daily chart, 4000 and 3800.

Almost there....After lagging behind the other indices is it the QQQ's turn to break out to a new high? QQQ has obviously been leading (not saying much) as of late. Growth seems to be ready to explode again.
So much short interest up here without a doubt. We have grinded the way up and that's not a bad thing necessarily.
Looking for a bit of a move up overnight/premarket then fade the gap after open. Will be heavily shorted almost surely again in that situation as the gap from weeks ago is still to be closed.
Perfect storm as we hold in the general range of ATH's.
Can good news catalysts rock the coke machine enough to pick a firm direction with some sustainability? The charts will tell us soon.

now dow have powerful sell sl=100point trail stop=100point tp= min 34000
green arrow=buylimit place with sl=100
orange fibo in left = trend base FIBO EXTENTION (projection)
for load it on metatrader right click or up,drawing tools, then load FIBO expantion (this tools good on zigzag market like dow and dax not good for trendy markets like gold)
draw it on last N shape in 30min chart(for day trader) for longterm trader draw it on 4hour chart
on your real ,if you pick profit from this signal , please send 5% of profit , CHEAR (coin) above my profile
www.tradingview.com
GOOD LUCK

Is DowJones Futures ready to move to newer high?So far Dow Jones Industrial Average is showing strength while Nasdaq showing weakness. Similar to what happened during February. Dow futures have been in tight range since last two weeks, maybe this week it is ready to breakout?

daw go up , buyer target is 34600 orange line=fibo extention level(fibo expantion in metatrader)
34800 is good place for sell with sl=150 point and tp= min 33200 max 29500

US30 short idea 14/4/2021 We're probably heading around 4% down. At the very least a correction, it might even continue.

-US30 Weekly Prediction- 4/11 - 4/16 What you should consider(Analysis based on the daily timeframe). Structure, volume profile, pitchfork trend analysis, fib retracement/extension, sentiment analysis, volatility gaging, and US bond yields
Follow for more daily ideas and precision charts


KO - A Long Term BuyKO.
Diet KO, reg KO, KO zero, I think they even have a hard seltzer.
They are still about $10 away from prepandemic Highs and, best of all they pay D I V I D E N D S.
adding it to my Long Term account in the form of shares.

YM1- Dow Jones - Short The Dow Jones (2h) chart shows us a strong upward trend registering historical highs, but we expect it to take a break of up to -2.4%, showing a decrease in the volume traded, to later rise due to the news of the stimuli and / or the political or social circumstances of vaccines without having events or important news scheduled CBOT_MINI:YM1!
Let's also take into account the RSI that indicates sustained overbought levels
This is just a suggestion, it is up to individual responsibility

🩸 🐖 "Bulls make money, bears make money, pigs get slaughtered"Hi guys after Friday rout there are new developments in stock market indicies. Last week price action on AMEX:DIA formed bearish reversal pattern buying climax above upper megaphone pattern line at the top of rising wedge. This rising wedge is 5th Elliot wave which is signaling trend will reverse soon.
As you can notice in chart last week realized volume was relatively big and volume week ago last week was rather small. Thats the signs that bears taking control significantly in recent days.
I expecting this week breakdown bellow megaphone upper line and begin forming corrective wave (a).
If you like the idea, do not forget to support with a 👍 like and follow.
Leave a comment that is helpful or encouraging. Let's master the markets together.

NQ MFI oversoldNQ, ES, YM, and RTY MFI all oversold so probably a bounce today but don't sure me if it doesn't go up, lol.
It will probably fade the gap up a bit before heading higher. Chart looks the exact opposite as yesterday, nice whipsaw, lol.
Probably staying out, not feeling very bullish, but yields went down overnight, so it should go up.

𝗖𝗵𝗮𝗿𝘁 𝗼𝗳 𝘁𝗵𝗲 𝗠𝗼𝗻𝘁𝗵: $DJI Monthly. Strong CandleBlowing out a 💫 w/ a large green candle and MACD looks very bullish
$YM_F $DIA $DJIA $QQQ $SPY $IWM $TLT $TNX $GLD $DXY $VIX $BA $GS $UNH $CRM $MSFT #Trading #Stocks #StockMarket 📈

𝗕𝗼𝗲𝗶𝗻𝗴 𝗨𝗽𝗱𝗮𝘁𝗲: $BA Weekly. Time to Fly?Biggest trade last year for us were Leap Puts anticipating the massive diamond breakdown on this POS company. They somehow survived #737MAX crashes AND #COVID. Micro wave-3 looks to be starting
$DIA $YM_F $DJIA #Stocks #Trading #Boeing ✈️
