Current scenario in Dow jonesHere we have the weekly Dow jones facing the MA200. It is interesting to notice that the MA200 was strong support for 10 years. Now the question is, will it become a resistance?
As always, we should always wait for confirmation!
YM1

Dow Jones Higher Low, Higher High w/ 38.2% Fib BeatDow Jones Futures are currently up nearly $900(4%) to $23,400 and has made a push above the 38.2% Fibonacci retracement level and out of the bearish lower levels of the total Fib range. With price moving above the 38.2% Fib level, price has also created a higher high and higher low which indicates a short-term uptrend so the view has now shifted from bearish to neutral with a bullish bias. Short-term resistance is expected to come in at the 50% Fibonacci level near $28,300, while a push above that level would put price back in the bullish half of the total Fib range. A bullish pullback from here would be any hold above the 38.2% Fib level with secondary support being at the 23.6% Fib. Going forward, price will remain in an uptrend as long as the 23.6% level isn’t violated.
With price making a higher high and higher low, the stop-loss level for long trades can now be moved from the previous doji candle last week to just below the higher low area. This higher low was at the 23.6% Fib level which acted as support for the past 8 sessions and represents an area of price demand prior to new highs being made overnight.
The Relative Strength Index(RSI) has now begun to move above the centerline at the 50 level. In general, an RSI reading above 50 indicates bullish momentum while an RSI reading below 50 indicates bearish momentum. A sign of bullish momentum continuation going forward would be a move above the 60 level.
The Price Percent Oscillator(PPO) continues to show the green PPO line rising above its purple signal line which indicates short-term bullish momentum. Going forward, the PPO needs to rise above the centerline at the 0 level in order for the intermediate to long-term momentum to shift bullish.
Overall, price is looking better here than it has at any other time over the past 5 weeks. A move above the 50% Fib level is critical here for bulls to maintain bullish momentum, with a move above the 61.8% Fib level needed to put price back into a true bullish trend.
I was previously expecting a move below the 23.6% Fib level, but with changing technicals comes a change in view, and right now traders appear to be bullish according to the technicals.

Buy Put Dow Jones (DIA/YM1!) Jun 19 '20 $160 @ $5.60Short Dow /YM1! for 16,000 Strike Price. Purchased at 21,000 @ $5.60 Put.

Dow Jones RangeboundThe Dow Jones Industrial Average is on its 8th day trading between the 23.6% and 38.2% Fibonacci levels while currently holding support at the 23.6% Fib level. As long as price is trading below the 38.2% Fib level the trend will remain bearish. Price is rangebound between these lower Fib levels while trending below the red downtrend resistance line which is also adding bearish pressure on price and preventing a move above the 38.2% Fib level.
The Relative Strength Index(RSI) is still trending below the centerline(50 level) which indicates that overall momentum behind price is bearish. An RSI(green line) reading above 50 is considered bullish while a reading below 50 is considered bearish.
The Price Percent Oscillator(PPO) is still showing the green PPO line rising above the purple signal line, with both lines moving upward indicating a short-term bullish momentum trend, but both lines remain below the 0 level indicating overall bearish momentum. A PPO reading above 0 is considered bullish, while a reading below 0 is bearish.
Overall, the trend behind the Dow Jones is bearish and I’m expecting an eventual move below the 23.6% Fib level as data releases continue to show extreme weakness in the U.S. economy.


𝗕𝗼𝗲𝗶𝗻𝗴 𝗨𝗽𝗱𝗮𝘁𝗲: $BA Weekly. 737 Max ProjectionPossible it goes for the ~250 gap, but my lean is the POS gets crushed. Doesn’t want gov assistance ... oh really? They weren't selling pre-corona. Revenue drop in 2020 will make 2019 look like nothing

Short YMThis could be the top of the countertrend rally based on trend lines
Short at 22020
Take profit at 15600
Stop above recent high

𝗗𝗼𝘄 𝗨𝗽𝗱𝗮𝘁𝗲: $DJI Weekly. 2008 PlaybookIn June 2008, #DowJones broke its weekly 200ema and key support (DotCom highs). It then backtested in following months before next major down move. The setup is similar now 🤓


𝗗𝗼𝘄 𝗨𝗽𝗱𝗮𝘁𝗲: $DJI Weekly. KEY TRENDLINE AT RISK#Powell and #PPT trying to save MAJOR long-term TL. Will they be able to do it in the next hour?? 👀🍿

Capitulation Long on All Indices + #OILWe have some major oversold readings yesterday and last night. I am predicting a bounce similar to FEB 2018. We tagged the Year CAM S3 target that I spoke of yesterday, and some other MAJOR targets as well for SPX500 futures.


YM Big buy opportunity Take actionYM is coming to nice trendlines + its natural market movement and not market crash.
Now it must to finish mesured range up. Take care friends.
Nano Silver Water can help to battle CoronaVirus! Important.


DJI Bear ScenarioAt this point, it's very obvious that the market is all about futures trading, intraday patterns don't follow through the next day, the gaps have gone the exact opposite direction of afternoon trading the past few days.
I don't think the market does it's next leg down until MFI gets overbought, the usual pump and dump. CHart pattern suggests a gap fill tomorrow, then it's all about the Fed. Could be a non-event like Dec or they can tank the market.
We'll find out tomorrow.

YM1! E-Mini-Dow DIA Indicators in the pane below favoring a breakdown to induce a Short that is now waiting.

DOW30 SHORT MONTHLY CHARTMany tools show me that price can easily now going to retest the trendline and even break it to the downside.


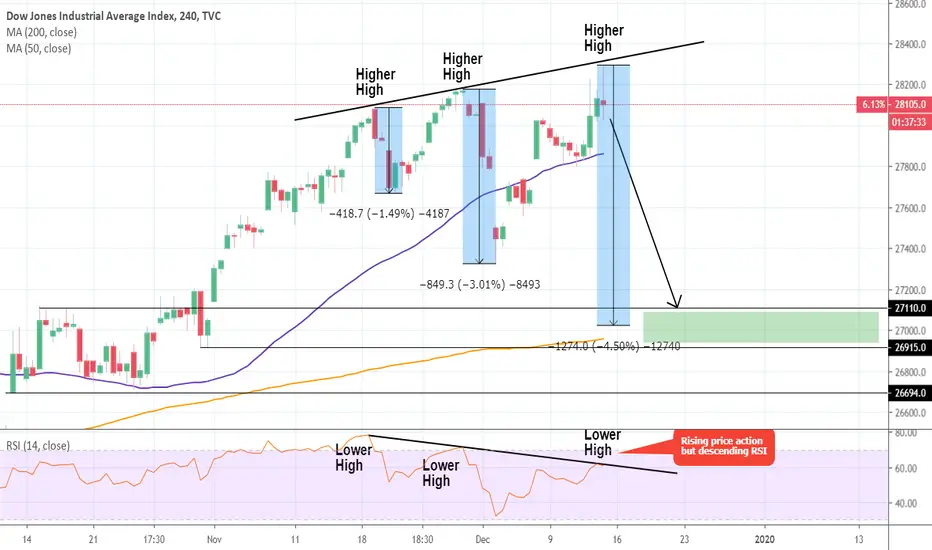
Dow Jones: Update on the short term price action.Following Trump's phase 1 trade deal tweets, DJI rose but the uptrend stopped on the Higher High (bold black) trend line on the 4H chart. With 4H technicals turning neutral (RSI = 56.131, MACD = 85.700, Highs/Lows = 0.0000), this may be an early signal that today's High may deliver a rejection.
How far can that go? The previous two Higher Highs delivered a rejection of -1.50% and -3.00% respectively. The sequence can be either 1.50% lower on every rejection or double the decline of the previous one. Assuming it is the first, more moderate scenario, the potential drop goes as low as the first two symmetrical Support levels: 27,110 and 26,915.
It is important to mention at this point that even though Dow Jones is making Higher Highs on that pattern since November 19th, the RSI sequence on 4H is actually bearish on Lower Highs indicating weakness.
** If you like our free content follow our profile (www.tradingview.com) to get more daily ideas. **
Comments and likes are greatly appreciated.
Dow Jones: 4H Death Cross. Potential minor or major pull back.Dow Jones futures have so far failed to recover the 28,200 All Time High and has turned neutral on 1D (ADX = 17.288, CCI = 8.0129, Highs/Lows = 0.0000). On the 4H chart we see a Death Cross formation emerging (MA50 crossing below the MA200). Within the monthly Channel Up we've been trading in for the majority of 2019, every time a 4H Death Cross emerged, the index gave 2 major pull backs (May, August) and 1 minor (October).
Given the fact that the major pull backs took place after tops on the Higher High zone (red color) and DJI marginally touched that region on the 28,200 High, we assume that the current pull back will be a major one (around -7%). The Target Zone on this one is 26,600 - 26,180.
** If you like our free content follow our profile (www.tradingview.com) to get more daily ideas. **
Comments and likes are greatly appreciated.

All major indices are bear flagging on the 4h chartBaring a false new.s or hope on trade with China, this is going down.
Just my opinion....
