MCG Upward moveJSE:MCG is showing some good upward momentum at the moment and could do well for a long position. Although the MACD and Stochastic alerted quite a while ago, the EMA's are confirming the upward momentum.
ZAR

GBP/ZAR:SWING FIBO RETRACEMENT UPTREND|LONG SETUP 🔔The forecast for the GBP/ZAR remains bullish after this currency pair finished a minor correction.
Can bulls take advantage of upside pressures and force the GBP/ZAR into its next horizontal resistance area?
Check the Links on BIO and If you LIKE this analysis, Please support our page by hitting the LIKE 👍 button
Traders, if you like this idea or have your own opinion about it, please write your own in the comment box . We will be glad for this.
Feel free to request any pair/instrument analysis or ask any questions in the comment section below.
Have a Good Day Trading !

BID possible shortWith today's price action so far, JSE:BID seems to be showing some good downward momentum. Based off of the EMA's crossing today as well as the stochastic and MACD moving downwards it looks like a downward move is on the cards. I predict that it could move down to the 28000 support level which would coincide with the support level around the 200SMA.

As predicted, things are getting worse in South Africa, part 2Guess it's time to follow up on my previous idea:
Body count is going up. Some officers (including high up) going full racist, for example one guy was saying the indians choose their camp (whites).
In a single raid over 1 million rounds were stolen, enough for a whole company to go to war (or capture more weapons).
SANDF getting chased by civilians, bah this happens in France too no big deal, and in Turkey soldiers are used as scapegoats then beat up by mobs.
Russia which is like the only country in the world not completely melted brain, recommended (strongly) to its nationals to stock up on food and water and lock themselves up at home during the pogroms. They didn't say bullets it seems, weird. I know that some guys have some tigers, I wonder how useful that is?
Sorry but I have to mention this: only one store in Watercrest Mall was untouched, the rest was destroyed. The untouched store waaaaas .... THE BOOK STORE! 🤣🤣🤣
"We have no access to education we are 200 elo because of our teammates and the unfair game patches".
(Some) Supply lines are destroyed. Queues of thousands to get in a store, never saw this before are these people for real? Factories burned down some leaking pollution. Boers going to have full stomachs and urban citizens going to go hungry let's go humanitarian bla bla bla would you like to make a useless donation to a useless NGO to feel better about yourself?
Told for 4 years people in the west cities sucked and either get out or stock on food and I wrote about SA too. I did my part, more useful than NGOS imo.
At least I help out smart people the rest is helpless it will never make a difference.
I don't know Africa below the equator my guess is Zuma which was just sent to jail for looting is a bantu zulu or something and Cyril something something is the same or almost the same? They're both from the ANC which is nothing more than (my guess, don't know anything under the equator). An ethnic map and political result maps are the same, half east is zulu/bantu/black and all green (votes ANC), the west half is yellow and votes Democratic alliance, as if no one cared for democratie and everyone voted for their tribe. The 3rd party is Extreme Flip Floppers, the racists. The far east is where the riots are worse. The west does have some green spots it's not homogeneous.
So same story as usual. With the president a western puppet following the diversity ideology. I've heard of whites indians and muslims on one side defending their stuff (and killing), bantus on the other. Just describing it as it is not saying it's good or bad. I'm not sure if the ANC is itself divided by ethnicity and tribe or not. Another smaller party is significant in the most eastern problematic region that is the Inkatha Freedom Party I wonder if they are separatists?
Jacob Zuma’s son urges South Africa rioters to ‘protest & loot responsibly’.
I know a lot of these guys hate migrants and indians (and muslims) are migrants. Idi is popular once again (he kicked out the indians).
Doesn't seem they hate whites that much I mean they were there before most of these guys afaik, whites were here since emm 1488 (not a joke).
"evidence linking ANC branches in KwaZulu-Natal to the violent protests"
www.timeslive.co.za
I wasn't around back then (I didn't know about investing I mean, didn't even know it existed) but I heard people invested in some countries like for example Ivory Coast, especially sugar there, and ignored the ethnic risk and when it went boom they lost everything, don't be that guy.
Maybe they use this as an excuse to disarm the population. If that happens genocide will be just around the corner. Then prob gets recycled.
Half of Rwanda eco growth comes from Paul Kagame pulling a sad face when he meets a western leader, and them sending money as a result.
GDP growth is something ridiculous like 10%.
The Hutu breed like rabbits, so the Tutsi convinced them they were gods to rule them, the white man ruined that, now they use guilt to continue their rule GG.
Maybe whites pay the price in blood then use guilt to once again rule the majority. The country would become rich again, great investment.
I'm too old to be an idealist, I am a realist. The idealists are the ones with blood on their hands. Too dumb to not be in denial about it.
Stupid people are worst than evil smart people since those ones refrain from pushing it too far out of fear of being stopped or punished.
I don't think the russians used the word pogrom although they don't care about euphemisms, here is the source.
Also Russians are taking over Africa militarly and don't believe in diversity and the west can't really do anything about it.
Maybe Russia will intervene? Let a few russians get killed and ...
With the collapsing west lighting candles, holding hands and singing songs as well as making diversity murals.
I do not think NATO would win World War 3. The world really needs ground air missiles, all sorts of nuke countermeasures plan A plan B all the way to Z.
Not having serious large scale measures and just counting on love and friendship is such terrible risk management.
russianembassyza.mid.ru
Of course I can't give any sort of timing. In the immediate term I hope this ends up shaking markets a bit.

USD/ZAR UPDATED ANALYSISYou can see if we put both the DXY and USD/ZAR next to each other how well they correlate at the moment. Both charts have retraced respectively giving a strong narrative that if the DXY respects the trend and moves higher, that USD/ZAR will follow suite. The South African economy has taken a huge knock this week due to extended Covid restrictions but more importantly, the looting of major retail enterprises. Yesterday South Africa released it's Retail Sales YY* results which came in at 15.8% which, when compared to the prior results of 95.7%, is insane. If you piece all of this information together then it is reasonable to assume that the Rand will continue to weaken against the Dollar for the foreseeable future.

DOLLAR/RAND ANALYSISPossible bounce off of support or a retracement before a continuation. Either way I see the Rand weakening against the Dollar due to the current state of the nation. Target 1: 15.00000 ; Target 2: 15.60000

USDZAR LONG on a Geopolitical and Technical basis #ZAR I have bought USDZAR. FX:USDZAR
Civil unrest has erupted in South Africa after the arrest of former president Jacob Zuma.
The currency pair has been in a downtrend since April 2020 and has just broken the downward channel to the upside.
I prefer trades with such a confluence of factors working in their favor. Let's see how this plays out.
- Sure Capital

BVT - LongJSE:BVT is sticking with the upward trend and has, once again, made a bounce off the upward trend line. Along with this, the stochastic, MACD and EMAs are all showing signs of upward momentum. I think we could see a move up to the previous resistance level at around the 22000 area.

AVI - Multiple bounces off of strong support levelJSE:AVI has bounced off of the support level at around 7000 numerous times since early 2020. It is struggling to make lower lows, so my prediction would be that it continues upward towards the 7550 area or at least to around the 200SMA.

Goldfields bounce off strong supportJSE:GFI bounced off of the strong support at around the 12700 level last week. In the past, it has gone up from this level. It is currently at another resistance level and if it breaks through that, I think it will go upwards for a nice long position.

SSW - Upward momentum within a downward channelJSE:SSW is showing some signs that it might be moving upwards for a bit. This is based on the EMA's crossing and the position of the stochastic and the MACD. It is, however trading in a downward parallel channel, so it might bounce off of the top of the channel and come down again. Bear this in mind when setting targets for this trade.

AGL UpswingJSE:AGL seems to be making an upswing at the moment. It recently formed a higher low and now with the EMAs crossing which was preceded by signals from the Stochastic as well as the MACD - I think we could see the upward momentum continue possibly all the way up to the resistance at around the 63500 area.

AMS - Possible long tradeJSE:AMS is looking good for a long position based off of our 3 momentum indicators. It has also recently found support and bounced nicely off of the 200SMA. I think we could see a nice upward move to at least the 180000 level and if it doesn't find resistance there and breaks through it could go all the way to around the 200000 level.


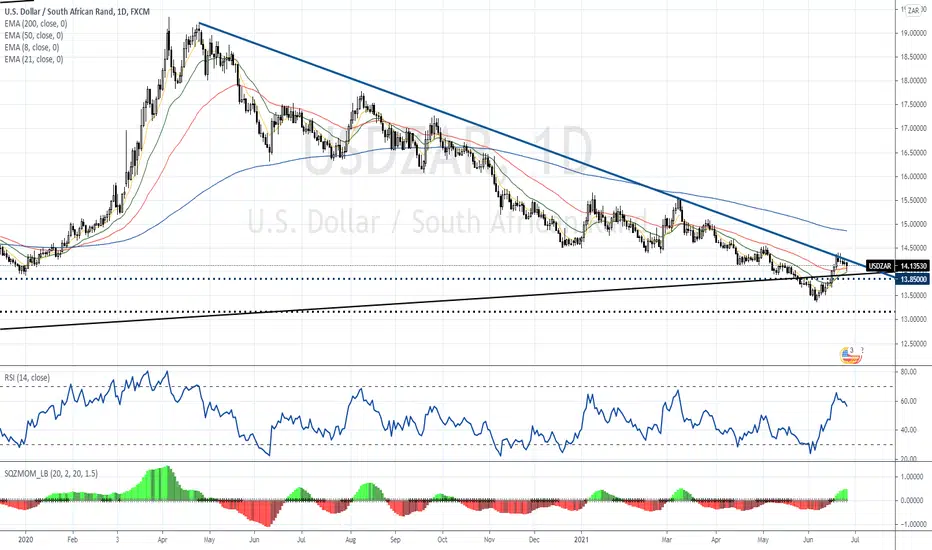
ZAR strength not necessarily overMedium-term bullish trend still seems to be intact for the USDZAR, after its recent weaknesses (strength in the US Dollar). It currently finds itself back at the 50-day Moving Average (EMA), with a break and close below R14.07, bringing back the strong support level at R13.95. This is a strong support level, with a break lower, most probably bringing back R13.50 (short-term target). Should we however see further weakness, with a break above the bullish trendline at R14.30, could see the USDZAR only find resistance again at the 200-day EMA at R14.86. For now, I still believe that the Rand is in oversold territory, which is confirmed by its 14-day RSI.

IS USDZAR READY FOR BRERAKOUT? Would love to see a nice breakout, with usd strength chiming in the market.
#BLESSEDPIPS


GOLD UPSIDEWith 10year treasury yields under pressure, high inflation, with expectation of a higher inflation print this coming Thursday, together with a weak dollar, this inverse head&shoulders pattern (hourly graph) has a very high potential of taking gold even higher.
Together with the ZAR that has reached a short-term bottom, I am bullish on gold miners having another bull run.

EURZAR bounce over a monthly support 🦐EURZAR on the 4 chart test the monthly support and start to trade to the upside.
The price is testing a minor resistance zone and according to Plancton's strategy if the market will break above we will set a nice long order.
–––––
Follow the Shrimp 🦐
Keep in mind.
🟣 Purple structure -> Monthly structure.
🔴 Red structure -> Weekly structure.
🔵 Blue structure -> Daily structure.
🟡 Yellow structure -> 4h structure.
⚫️ Black structure -> <4h structure.
Here is the Plancton0618 technical analysis , please comment below if you have any question.
The ENTRY in the market will be taken only if the condition of the Plancton0618 strategy will trigger.


ZAR Potential 12.100 moveIf price finds a way passed the current daily support. Price will fall down to the 12.100 - 11.000 range in the months to come.
Comment Like Follow
Press the Like button to agree or disagree

Barloworld short if trendline brokenJSE:BAW is showing downward momentum based on the stochastic, MACD and EMA's that have just crossed. However, it has been trending upwards since the 26th of March and I will wait for a convincing breakout through the upward trendline before considering a short. If this breaks, we could be looking at a move down towards at least the lows formed at the beginning of the upward trend.
