BVT - Descending Resistance breakJSE:BVT has opened on the other side of a descending resistance level which could signify an upward move if confirmed above today's high. There is a strong resistance level at 19000 so be mindful of that.
ZAR

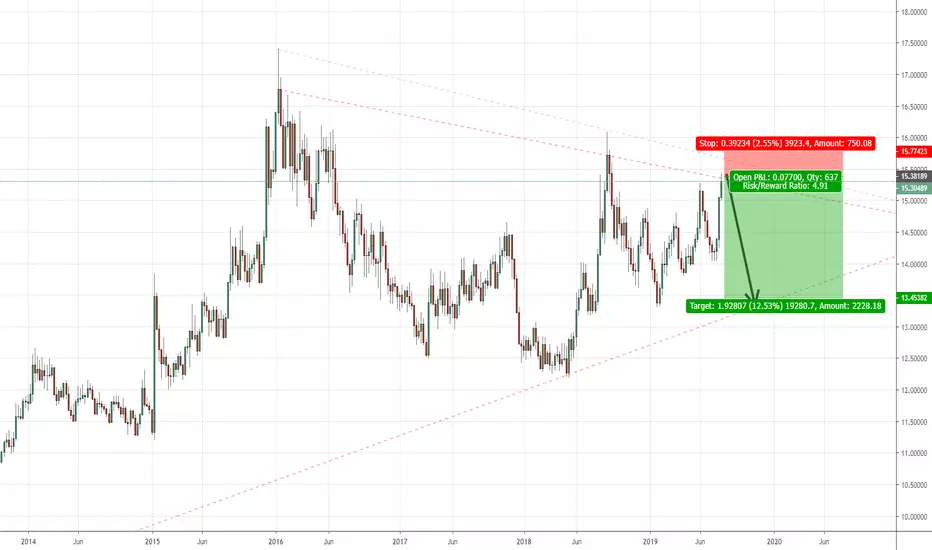
ZAR USD Long ideaThis is my idea the direction ZAR/USD is going to take .
Due the economical situation is ZAR and spring compeing up the economy is going to start up again from the septembar .
Recovering ZAR up 10 % while it is going to hit the resistance of the market , unless we see some surprising events from the White house.
I am still new to this so my apologize if something is missing .
I am opened for all suggestions and recommendations how to improve myself .
Thanks you for understanding ...

REM descending resistance breakoutJSE:REM has broken through a descending resistance level. If it confirms by closing above it at the end of today, we would be looking at a long position tomorrow.

NED - Possible reversal imminent JSE:NED formed a doji candle yesterday which means that the market has lost it's sense of direction and is vulnerable to change. Keep an eye on it and if it breaches around the 23600 level, I will consider a long position.

AMS Piercing line JSE:AMS has formed a piercing line at a support level. This could signal an upward move.

TFG Heading for strong supportJSE:TFG is heading downward towards a very strong support level that it has tested 7 times in the past. As always, wait for confirmation, but we can possibly expect a bounce off support and a move upwards.

FSR - Bounce or Break?FSR is at quite a significant support level and as things stand, it could bounce off the support level and continue upwards or break through and head downwards. Either way, we should still wait for a confirmation candle before jumping in.

AGL - Broken through previous lowsJSE:AGL has broken through a quite significant support level and confirmed it with an open and close below. We could continue downward with the current momentum.

AGL - Broken through previous lowsJSE:AGL has broken through a quite significant support level and confirmed it with an open and close below. We could continue downward with the current momentum.

USD/ZAR weekly downtrade but daily created uptrend opp.Firstly USD/ZAR weekly downfall (yellow lines) started in 03/09/18 is still continuing and it may continue until May 2020. It's also supported by RSI and Parabolic SAR indicators. Support line of this trend is 13,82. You can see the chart attached below;
On the other hand when you zoom in to daily chart; Steep downtrend in green line has been broken both on price and RSI indicator.
You can see the 13,82 support worked very well, it tried to break support 5 times but rejected each time. After that the price broke the green downtrend and started to go up to yellow resistance line.
Geren arrow: Critical point in here is that if it can break the yellow resistance trend (started in 3/9/18) and go up to 15,47 resistance which seems unlikely to me but possible.
Red arrow: Or would it fail to break 14,75 (yellow line) resistance and go back to weekly downtrend channel. This way it may test 13,82 support again.
For both scenarios we have to check if the moving average (orange) will break thorough bollinger and if RSI will break the yellow downtrend and 70 point.
My play would be waiting until it reaches yellow weekly down trend line, than to see the reaction to see break/bounce and go with it.

#USDZARTime range specified;
We have divergence;
In case of successful breakthrough of Methuen Yellow Range to Green areas;
Support and resistance are identified;

APN - Triple bottom formingJSE:APN seems to be forming a triple bottom at the bottom of a parallel channel. If it fails to make new lows, we could possibly see a long movement up towards the top of the channel.

NPN Triangle BreakoutJSE:NPN has broken out of an ascending triangle and looks good for a small upward move.

Naspers possible reversalJSE:NPN has broken through an ascending support level with a bearish engulfing candle. Looks like a downward move will happen if it is confirmed by today's price action.

MTN at strong resistanceJSE:MTN is currently at quite a strong resistance level and the expectation is that it will find resistance again. If it bounces off the resistance level, we will look to enter a short once it breaks through the fractal of 26th of July.
If it breaks through the resistance, we could possibly be looking at a potential long position.

Mediclinic - Bearish Engulfing @ ResistanceJSE:MEI is showing a bearish engulfing at an established resistance level. If it confirms by going lower than yesterday's candle I will consider a short.

Mr Price - Breakout or Bounce?JSE:MRP is heading towards the bottom of a channel that it has been trading in. If it breaks through the bottom, I will consider a short position. Conversely, if it decides to bounce off the bottom of the channel, I will wait until it breaks above the high of today before potentially entering a long position heading towards the top of the channel.

Investec consolidation breakoutJSE:INL has been trading in a parallel consolidation channel since December but it seems to be breaking out with today's price action. If it confirms with tomorrow's price action, it could be setting up for a short position towards the support zone around the 7700 level.

RDF going downJSE:RDF has broken through an ascending support level and confirmed by opening and closing the next candle below it. It is looking good for a short position but I would wait for confirmation from the breakout of the fractal from 8 Jul before entering.

BVT range breakout After trading in a range for quite some time, JSE:BVT has broken through the strong support at 19000.
A confirmation below the fractal level of 3rd of July could signal a nice downward move.

Truworths - break through strong supportJSE:TRU has broken through and is busy confirming a downward move with today's price action. We could be looking at a nice downward move it continues downward today.

OMU - Short on Momentum StratJSE:OMU has broken downwards through an ascending support line. This is confirmed by the crossing of the EMA's as well as the downward direction of the Stochastic and the MACD.
