ZECUSD Forecast: 37.29% IncreaseExpect ZCash to increase 37.29% with a take profit at 255.00.
Price closed above trend line, ema 10, and ema 20. Enter price at 185.74 which is the closing price of the candlestick.
Zcash

ZEC ready to dump! BE PREPAREDZEC has had one incredible run up to the T200 mark.
However, as I stated in a previous video today: ZEC poised to be trapped within it's descending triangle from over this past year. Zcash is in a historic downtrend right now.
-Note the RSI in purple at the bottom of the screen
-As I pull back to look at the daily ticker, you will notice that the strength index has progressively gotten more and more saturated throughout this hyper positive trend
-Any RSI that saturated and just... straight-up -wettt- is going to finally get overstimulated enough to want to tap-out.
New traders : MAKE SURE you take the time every once in a while to pull back on a daily or even weekly ticker and ident your positive or negative overall trends for a token.

🚨 ZEC Beware 🚨 @~T200 Quick video detailing the fact that ZEC will meet strong resistance once meeting the downward trend at some point in the coming months.
(ZEC will drop back to it's weekly pivot)
Make sure, before you start poppin' cherries on hot tokens you'd never charted/hadn't charted in a while, look back at the daily and make sure you're not going to get shanked at the historic down-trend.

XMR bursts through the resistance trend!! ~204 to ~208Discussing XMR breaking through the trend to hopefully give us another nice pump up to the first resistance pivot
also discussing ZEC at the end, and the fact that ZEC is on a historical downward trend.
EDIT 03/24/22 @1805hrs MDT just noticed in my little ZEC analysis that historically, ZEC is forming a nice little triangle breakout with my bottom trend line. I think I am going to follow this, chart it some more and see where it goes. Happy trading everyone! ALSO: NOTICE XMR's HISTORIC VOLUME.... 🛫☁☀️👆

ZECUSD attempting double bottom breakout. $196 possible target. Luna completed it’s double bottom breakout with ease, and considering we only just recently shifted back into an uptrend I’m assuming this double bottom as well as several other cryptos double bottom patterns are likely to trigger as well. Of course, as always we should wait for confirmation of a bullish breakout from this pattern, not go off assumptions, and currently the price action is finding resistance upon testing the double bottom neckline. Once it flips it to solidified support and then we see a nice impulse of bullish volume afterwards we can be more confident that it will validate the breakout. If so the target is $196. *not financial advice* Until then this idea will have to be listed as neutral despite myself having a bias towards the bullish outcome.

Zcash Reversal Rally potential on Low Time FrameA purely peer-to-peer version of electronic cash would allow online
payments to be sent directly from one party to another without going through a
financial institution.
Digital signatures provide part of the solution, but the main
benefits are lost if a trusted third party is still required to prevent double-spending.
We propose a solution to the double-spending problem using a peer-to-peer network.
The network timestamps transactions by hashing them into an ongoing chain of
hash-based proof-of-work, forming a record that cannot be changed without redoing
the proof-of-work.
The longest chain not only serves as proof of the sequence of
events witnessed, but proof that it came from the largest pool of CPU power. As
long as a majority of CPU power is controlled by nodes that are not cooperating to
attack the network, they'll generate the longest chain and outpace attackers.
The network itself requires minimal structure. Messages are broadcast on a best effort
basis, and nodes can leave and rejoin the network at will, accepting the longest
proof-of-work chain as proof of what happened while they were gone.

Zcash vs Bitcoin must avoid the 1D Death Cross!Zcash is an implementation of the Decentralized Anonymous Payment scheme Zerocash, with security xes and improvements to performance and functionality.
It bridges the existing transparent payment scheme used by Bitcoin with a shielded payment scheme secured by zero-knowledge succinct non-interactive arguments of knowledge (zk-SNARKs).
It attempted to address the problem of mining centralization by use of the Equihash memory-hard proof-of-work algorithm.
Zcash (ZEC) - March 23Hello?
Traders, welcome.
If you "follow", you can always get new information quickly.
Please also click "Like".
Have a good day.
-------------------------------------
(ZECUSD 1W Chart)
(Full: )
We need to see if we can break out of the two downtrend lines while maintaining the price above the 162.04 point.
A move above the 239.40 point is expected to accelerate the uptrend.
You need to see if it is moving higher than the two downtrend lines around the week that includes the 25th of April.
-------------------------------------
(ZECUSDT 1D Chart)
Resistance range: 209.6-232.7
Support section: 94.0-117.1
However, it is important to keep the price above the 163.4 point to continue the uptrend.
-------------------------------------
(ZECBTC 1W chart)
Above the 0.004341-0.005954 interval: Expect an upward trend reversal
Above 0.008700 point: Expected to create a new wave.
However, it is important to get support above the 0.003299 point in order to break out of the 0.002058-0.004650 section, which is the bottom section.
------------------------------------------------------------ -------------------------------------------
** All indicators are lagging indicators.
Therefore, it is important to be aware that the indicator moves accordingly with the movement of price and volume.
However, for convenience, we are talking in reverse for the interpretation of the indicator.
** The MRHAB-O and MRHAB-B indicators used in the chart are indicators of our channel that have not been released yet.
(Since it was not disclosed, you can use this chart without any restrictions by sharing this chart and copying and pasting the indicators.)
** The wRSI_SR indicator is an indicator created by adding settings and options to the existing Stochastic RSI indicator.
Therefore, the interpretation is the same as the traditional Stochastic RSI indicator. (K, D line -> R, S line)
** The OBV indicator was re-created by applying a formula to the DepthHouse Trading indicator, an indicator disclosed by oh92. (Thanks for this.)
** Support or resistance is based on the closing price of the 1D chart.
** All descriptions are for reference only and do not guarantee a profit or loss in investment.
(Short-term Stop Loss can be said to be a point where profit and loss can be preserved or additional entry can be made through split trading. It is a short-term investment perspective.)
---------------------------------

Long Grayscale Zcash Investment Trust, soon to be a Zcash ETFThis is a no-brainer. my actual entries are $13.75 so this is a late push on trading view breakout

PirateChain (arrr) is going great because it's Fungible Recently PirateChain (arrr) broke through the upper resistance of a falling wedge and it has rose non-stop ever since. How much further will it go? I believe the real reason it's rising is due to the sanctions on Russia and the Oligarchs. PirateChain is Fungible (which means) you can't tell one cryptocoin from another--it's truly anonymous. I believe they are using PirateChain to move assets which is causing the rise in price. The time to get out would be when news of sanctions being lifted starts to come out. Until then expect to see PirateChain continue to rise.
Also ZCash (ZEC) is another that is capturing some of the oligarchs market, but not as much as it's not really fungible.
BTW: if you think this is helping the oligarchs by buying into PirateChain, it's just the opposite. By purchasing PirateChain (and/or ZCash) and then getting out BEFORE sanctions are lifted you're making them pay a premium for the crypto and then taking a loss when they cash out after sanctions are over.

Zcash (ZEC) Long-Term Channel Drawn (101% Potential Profits)Notice the "blue channel" in which ZECBTC is moving...
There is potential for a challenge now of the upper trendline.
My classic signals (MACD, RSI, EMAs, etc.) are also present and bullish. Some early others confirmed.
We can aim at the upper channel trendline as target or the 0.786 Fib. extension level for the whole structure since January 2021.
I believe the chart to be self explanatory.
This isn't any type of advice.
Just sharing what I see on the chart.
:)
Namaste.

Bullish div & support ZEC weeklyWeekly:
Weekly bar closed high and gives us a bullish divergence, including a bounce off of support. Entry around 126 (wait for a pullback on a shorter timeframe).
A bottom has been formed and the weekly bar closed positively, showing a strong rejection of that support level and stochastic RSI came from an oversold condition, now curling up from this condition.
After the bullish divergence on the daily, see previous trade that worked out very well that downtrend seems to reverse
Entry: 126-128,5
SL: 102 (will move it up)
TP1: 177 (resistance)
TP2: 180 (1 ATR level, or higher, I'll let this remainder run probably with a trailing stop)
2022#003

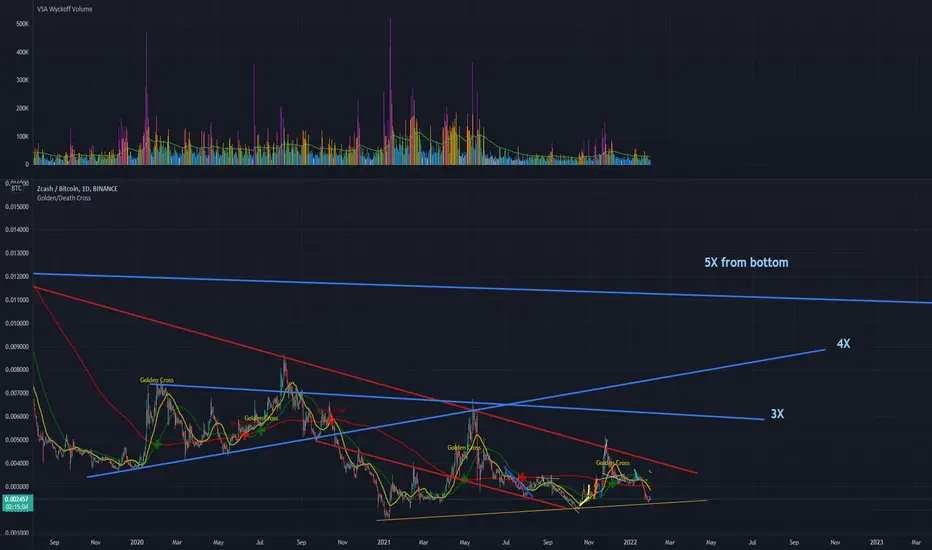
Binance Market - Zcash vs Bitcoin - double bottom reversalMaximum near term target is 10X from the local bottom which about 0.019000
the 5X target looks more reasonable 0.0110000
less ambitious targets also relevant. Primary drivers are the supply shock squeeze, and whether or not Robinhood App includes Zcash in its new set of crypto asset markets.
Its already got access to the #2 and #3 FOMO apps which are WeBull and Public.com

#ZECThere has been an uptrend since January 24. The level of $125 was strong, but we managed to consolidate higher.
The next very serious resistance line will be at $190. If we consolidate above it, I expect a strong growth.

ZEC Near 16% Gains on SaturdayZcash (ZEC) was trading by over 16% higher as of writing this, as prices rose to their highest level in over three months.
After trading at a low of $748.86 yesterday, today’s high of $777.63 saw ZEC/USD break past its long-term ceiling of $772.20 in the process.
Saturday’s peak is the highest point that the price of ZEC has traded since December 9, and comes as price strength appears to be overbought.

ZEC Breakout Confirmation NeededZcash has realized a bullish reversal this week as the markets absorbed inflation reporting, the EU parliament excluded language restricting Proof-of-Work from MiCA, and the Federal Reserve clearly conveyed no substantive change to monetary policy in the immediate future.
Bullish price action likely to continue if ZEC confirms a breakout from the descending triangle with a daily close above the trendline, idealing realizing $170 support with a clean bounce.
Broader markets appear poised to enjoy bullish sentiment for next few months given midterm elections this fall.
Significant risk of further inflationary pressure resulting in a monetary policy reversal cannot be ignored.
Closely watch CPI & PPI in the coming months as these likely will see further sharp increases that will ultimately result in Central Banks reversing course.

Monero up by 30%A report that United States President Joe Biden will soon sign an executive order regulating cryptocurrencies sparked a surge in prices for privacy coins, Monero and Zcash this morning.
The privacy coin surge was not clearly linked to Russian sanctions or if this was the reason behind it. Regardless, the surge was a result of something, moving from US$169 to US$204, up 29.2% in an hour and a half.
There were fewer privacy coins with a smaller size. Dash gained 11% to $95. The Pirate Chain price rose 7.4% to $1.11.


ZEC Weekly StudyLet's see how this goes.
Min: 800 USD
--> previous ATH
Long Term Target: 30.000 USD
--> halvings, proof of work, ecc, privacy as a public good, human rights, inflation ++ narratives.


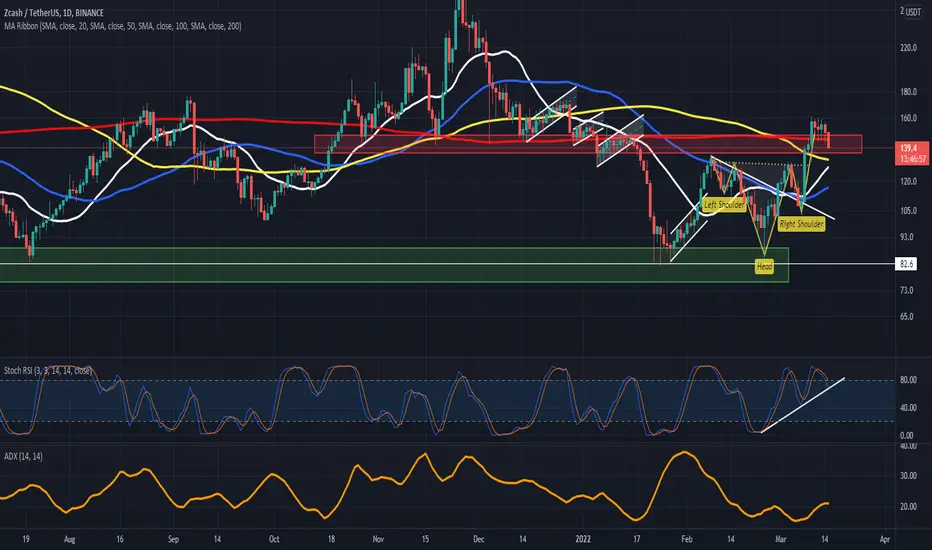
$ZEC Volatility Trend = Sub $90 TargetCharting from Daily to 3-Day charts reflect head & shoulders pattern forming with the left shoulder and head formed. Given price action trends with wild swings up and down, Zcash will either retrace fully to sub $90 or probable right should forms before final retracement.
Once retrace by >70%, historical $ZEC price realizes bullish reversals.
Continuing to see lower highs since 2018, to include May & Nov 2021.
$ZEC has volatile price movements... recently:
1. +116% late Nov 2021
2. -73% from local Nov 2021 high culminating on Jan 24, 2022
3. +89% Feb 24, through Mar 10, 2022
Further downside pressure is likely given the broader macro-environment with inflation spiking, bond yields climbing, and the Federal Reserve meeting on 3/16 with expected rate hikes followed by tightening monetary policy and scaling out of quantitative easing.

ZEC Sub $90 Limit Orders? ZCash large triangle May 2021 local high with breakout in August to reach lower high in Nov forming a smaller triangle.
Higher time frame shows massive double top with lower high in Nov 2021 than May 2021.
6 hour chart shows price action forming a head & shoulders pattern with Price target sub $90 before potentially recovering above $130.

Bulls receive a rejection from the $160 mark The Zcash coin has been slipping lower since beginning of this week and has lost almost 9.8% in just 3 days in price.
The market cap of the ZEC token is down 8.7% over the last night, which is now $1.9 billion.
Panic sellers are approaching the 200-day moving average on the daily price chart. If the bears manage to close today's price candle below the 200-MA, the remaining MA could act as a support level for the buyers.
Stoch RSI is retreating from the overbought area. The RSI is likely to bounce back from the bullish trend line (white). Furthermore, the Average Directional Index is indicating a weak bearish momentum for the ZEC coin.
Today the price of ZEC has slipped below the narrow horizontal range the coin was trading in for over 4 days. The 100-MA could act as a dominance zone for buyers for the upcoming trading sessions.
Resistance level- $190 and $300
Support level- $100 and $80