ZECBTCHello Crypto Lovers,
Mars Signals team wishes you high profits.
We are in the daily time frame. We have a resistance line which the price hit 3 times and could not break it. Currently we have had a support line which has bounced the price back up. If the price receives support here it will move up to R1. But if it breaks S1 it will move down to S2. Those who want to take risks can buy it here for R1 but if you want to be more secure in your trade you can wait for it to come down to S2 and then buy it.
Warning: This is just a suggestion and we do not guarantee profits. We advise you to analyze the chart before opening any positions.
Wish you luck
Zec

zecusdtZecash sitting nicely above the uptrend support line
RR is good TBH
I'm buying here
targets and stop-loss is on the chart
KUCOIN:ZECUSDT

💡Don't miss the great buy opportunity in ZECBTC @ElectricCoinCoTrading suggestion:
". There is a possibility of temporary retracement to the suggested support line (0.003339).
. if so, traders can set orders based on Price Action and expect to reach short-term targets."
Technical analysis:
. ZECBTC is in a range bound, and the beginning of an uptrend is expected.
. The price is above the 21-Day WEMA, which acts as a dynamic support.
. The RSI is at 56.
Take Profits:
TP1= @ 0.003707
TP2= @ 0.004074
TP3= @ 0.004373
TP4= @ 0.004700
TP5= @ 0.004944
SL= Break below S2
❤️ If you find this helpful and want more FREE forecasts in TradingView
. . . . . Please show your support back,
. . . . . . . . Hit the 👍 LIKE button,
. . . . . . . . . . Drop some feedback below in the comment!
❤️ Your support is very much 🙏 appreciated!❤️
💎 Want us to help you become a better Forex / Crypto trader?
Now, It's your turn!
Be sure to leave a comment; let us know how you see this opportunity and forecast.
Trade well, ❤️
ForecastCity English Support Team ❤️

💡Don't miss the great buy opportunity in ZECBTC @ElectricCoinCoTrading suggestion:
". There is a possibility of temporary retracement to the suggested support line (0.003339).
. if so, traders can set orders based on Price Action and expect to reach short-term targets."
Technical analysis:
. ZECBTC is in a range bound, and the beginning of an uptrend is expected.
. The price is above the 21-Day WEMA, which acts as a dynamic support.
. The RSI is at 57.
Take Profits:
TP1= @ 0.003707
TP2= @ 0.004074
TP3= @ 0.004373
TP4= @ 0.004700
TP5= @ 0.004944
SL= Break below S2
❤️ If you find this helpful and want more FREE forecasts in TradingView
. . . . . Please show your support back,
. . . . . . . . Hit the 👍 LIKE button,
. . . . . . . . . . Drop some feedback below in the comment!
❤️ Your support is very much 🙏 appreciated! ❤️
💎 Want us to help you become a better Forex / Crypto trader ?
Now, It's your turn !
Be sure to leave a comment; let us know how you see this opportunity and forecast.
Trade well, ❤️
ForecastCity English Support Team ❤️

spot & hold ZECevery time such as a crocodile buy cheep
and hold.
now our strategy in 2022 is SPOT.
we buy ZEC/USDT for 30% profit

ZECUSDT Triangle formation!ZECUSDT (1H Chart) Technical analysis update
ZEC/USDT currently trading at $153.9
zec forming symmetric triangle in 1h chart, if triangle breakout we can expect up move in zec.
Buy level: Above 154.5 (only buy after symmetric triangle breakout
TP 1: $158
TP 2: $163
TP 3: $170
TP 4: $180
Stop loss:$146
Max Leverage: 2x

lONG ZECASH Price action is resting at the bottom of a strong level of demand . Slight signs of seller weakness on the RSI off of these lows
Low risk entry at this zone !


Zec 2022 Bull and Bear Run TargetsPurely speculative.According to this TA, Zec target of 2800 in May/June 2022. Bear to 550 USD. The blue fractal is the 2013 BTC fractal where both coins have the same emission. Have fun. Sausage Dog.

🔥Zcash short signal#ZEC/USD
🔥Zcash short signal, we hit the resistance zone, now we are falling down.
Subscribe to the channel, fresh signals every day! ✅✅✅

Almighty Pushuponly
ZEC Long Overdue
The narrative is simple - there is none. ZEC is and will always be the most forefront in privacy based currencies. If you believe in brand and originality like most do with BTC not losing its top spot - then you can believe ZEC wins out in privacy. Privacy will become a global trend for the next 10+ years. in this you will see demand for a privacy currency that caters to real life transactions.
Trade the hype on most of the market and stack ZEC with 25% of your profits and you will not be disappointed.

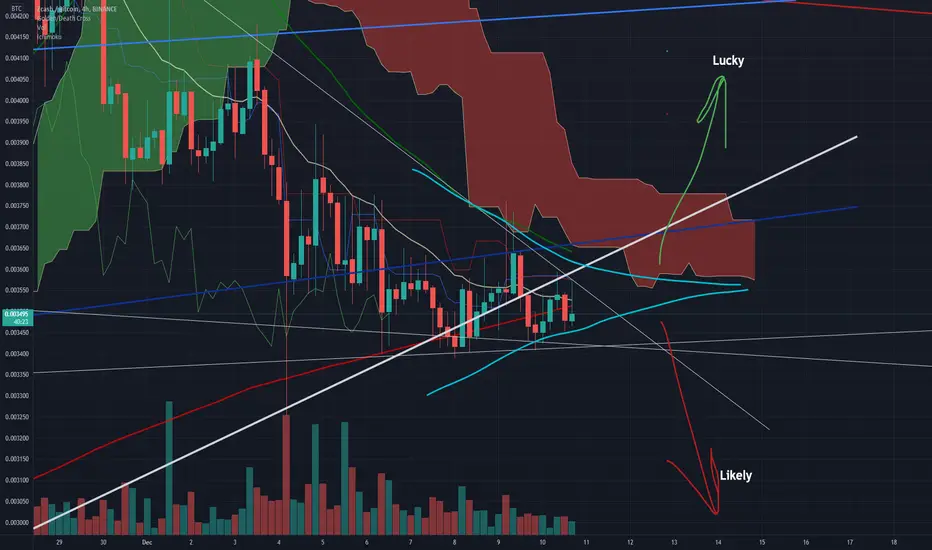
Zcash vs Bitcoin about to Select the Likely OutcomeHope that i get this one wrong, and we get lucky instead.
Bitcoin is very weak, looks a lot like the end of the cycle printed Thanksgiving and then mega flush was the Kiss of Death
No altcoins will outperform Bitcoin if the macro cycle is over. if cycle continues, Zcash may get lucky - they have a big positive catalyst in January: HALO NU5 Network Upgrade with many great features
$ZEC looking like a fat bag rnLooks like a big ole bag over here just waiting for the taking.
MACD is curling towards a bullish cross. 200 day MA held the line. RSI is on the verge of a test at 50.
If the RSI test at 50 fails, this trade could go bust. But remember more often than not it takes more than one try to break through a significant level no matter what the metric.
Either way, Zcash is looking primed and ready for some significant moves (most likely to the upside).
Targeting $300 at least. Might sell some at $250 to play it safe and lock in gains.

ZEC TRADE ENTEREDZEC inverse head & shoulders confirmed on hourly and position entered. possible retest on neckline before pump.

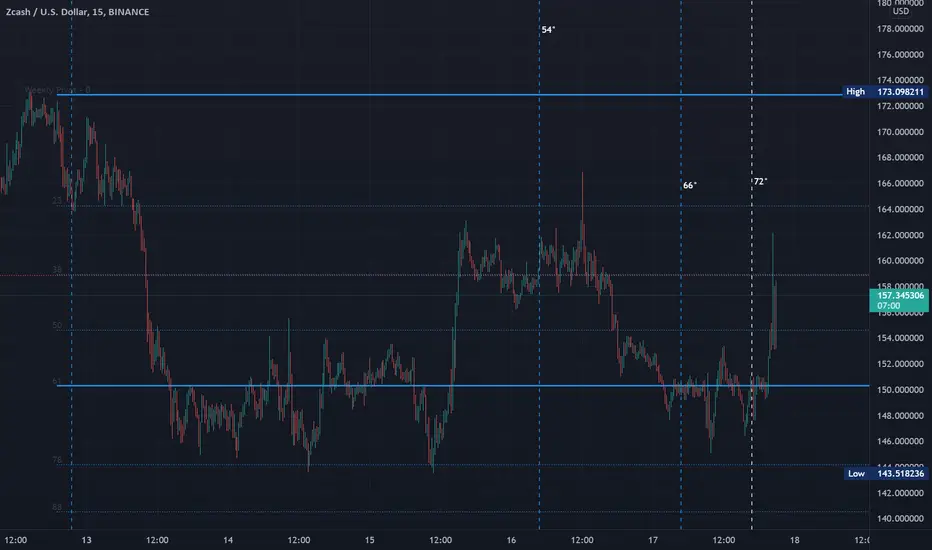
$ZEC aka Zcash astro analysis On the daily it looks like it touched a support horizontally, on 15min it looks like its making higher lower. I'm targeting 170+ full moon swing.
Lets get that 3 StartedBigger Wave 2 seems to have been completed and we have just finished wave 2 of 3
Maybe a reason to fasten seat belts :-)

1980s vibes radical privacy vaporwave ZCASH TA USDThroughout the western world, new systems have risen up whose job is to constantly record and monitor the present
- and then compare that to the recorded past.
The aim is to discover patterns, coincidences and correlations, and from that, find ways of stopping change.
Keeping things the same.

Zcash ZEC bitfinex short positions index ready to squeezeLook for the tallying to reach 6,000 or more then flush out to the baseline
Bitfinex is a tough read now that the platform is much less popular

Zcash rapid reverse intra-day setuplooks like sellers are getting exhausted. Barry Silbert teasing the idea of another $85,000,000 bid for more Zec
this will turn into a vicious bear trap at some point in the upcoming 5-7 days

ZEC/USDT (ZCash)ZEC/USDT chart showing major support and resistance levels / trendlines. Soon we will hit 300 USD Again imo :)

interim long 01295matched analysis against ZECUSDSHORTS and ZECUSD
Will have a lot of reasons to pump higher with YCash fork coming up in July, this can move up 100% from 011

Short Zcash USD - Fools Fuel The Short SqueezeThere is no sane reason to short Zcash until next year (or price reaches $2,000)

Zcash due for a decision this weekend or sooner.can't drift around at $215 - $230 forever
if it falls under the white horizontal. expect $200 -190
if it breaks up through the white diagonal, expect $300 quickly
EoY target remains $1,000 - assume Bitcoin reverses and prints new ATH in December also
