Which way?Anyones guess, imo.
ZEC/BTC up or down to these confluences.
Bullish Case: at the Golden Zone retracement, can move up to range high.
Bearish Case: at the 50 of range, can drop back down to 25% area of the range or even deeper.
Zec

ZECUSDTAs you can see on the chart, we've got 2 possible scenarios but both with upward movement. Even though I am already in the trade, I still think that there's a great chance we might drop to 0.382 Fibonacci level before moving upwards. Trade safe! Don't forget to put stop loss and DYODD.

Z-Cash - Time to go Long againLooks like Z-Cash is either going up or down here - it's slamming into a Gann fann extension it's strongly rejected twice already, so likely, UP. I'm a big Z-Cash believer so I tend to think moon-time is close, especially with recent partnership news with THOR Chain


ZCASH : PRICE ACTION IN HIGH TMF - PRICE IS GROWING ! 🔔Hello Everyone ! ! I hope you'll Appreciate our Advanced Analysis on Price Action !
Check the Link on BIO and If you LIKE this analysis, Please support our page by hitting the LIKE👍 button
Feel free to request any pair/instrument analysis or ask any questions in the comment section below.
Strategy : BULLISH CHANNEL + FIBO RETRACEMENT
Have a Good Take Profits ! ! !


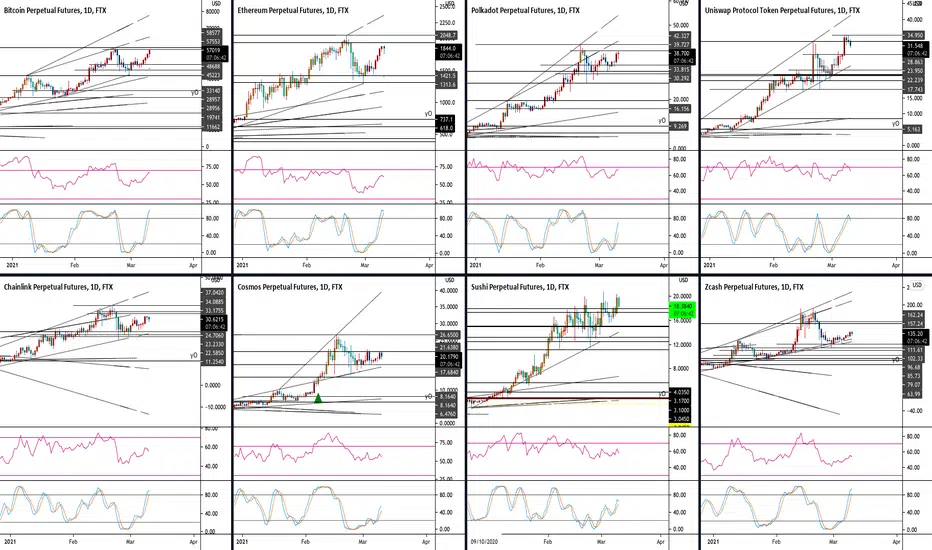
brypTo boNaNzaThese are 8 brypTos I am (re)accumulating since February's dip, in anticipation of an absolutely massive Q2. Also, Q2 price targets.
________
$BTC 113,395
$ETH 4,013
$DOT 81
$UNI 64
$LINK 73
$ATOM 52
$SUSHI 41
$ZEC 339
________
ZEC - Ready For Higher High? Hi, in the next couple of days we are getting ready for bullish momentum. We saw the support level $105-107 held very well + the support RSI(45) + SMA50. Now we are getting ready for resistance $149-152. If we break $150, the next target is $230. So be patient and don’t panic 🙌🏼

ZEC/BTC opportunity of a lifetimeHave shared this mostly among close friends. But after reading path and zoomerjd's posts, i felt inspired to share my own thoughts with tv. While my writeup lacks the fractal geometrical genius and metaphorical poeticness present in theirs, the general overarching idea is the same.
Fairly simple thesis - privacy coins haven't been hyped for 3-4 years. They will probably get hyped at some point as an alternative storage of value to BTC. The two largest privacy coins currently have a combined 0.6% of BTC's market cap. What is fair market value? currently that is 0.6%. What could it be in the future? who knows. ZEC/BTC hit all time lows in December, while XMR/BTC hasn't done much better, not seeing ratio this low since prior to the 2016 alphabay pump.
1) Good privacy crypto coins have never been in the spotlight. They were outshined by smart contract platforms, dental rewards program coins, etc, in the 2017-18 cycle and currently by Defi coins in the 2020-21 cycle. Holding a privacy coin is only for masochists at this moment in time in most people's eyes. A small part of every single Xmr/Zec holder secretly wishes they had bought another coin like Aave or Kusama.
2) At some point, the privacy narrative will catch fire with tremendous hype when people realize how transparent everything is on existing blockchains. Sure, it is annoying for some whales to have their addresses revealed if they're yield mining $500k per week, but for those profits, they will tolerate that intrusion of privacy. Everyone knows long term these yields are not sustainable and there will be a point where some of these whales that have millions of dollars probably don't want to have their every single move on the blockchain be tracked by a 3rd party website.
3) The 2 best known privacy coins- Monero and Zcash. Each have had their controversies. XMR with its initial (perhaps intentionally) crippled miner release in 2014 and pre-RingCT issues. ZEC with its trusted setup process, the founder's reward, difficulty in counting actual supply, etc. Both coins have been going through 3-4 years of downwards price action and taken a lot of punishment price-wise. I believe the final capitulation we've been dreading and hoping to avoid finally happened after the December Bittrex delisting announcements.
4) XMR has only had one pump ever in its lifecycle, during the alphabay/oasis pnd in fall 2016 (and then the bithumb listing pump in 2017 which did about a measly 3x). Zec had its only notable one during June 2017 when it still had a low circulating supply, and has been weak ever since. Any mention of these two coins generally get a lot of laughs and ridicule on CT (pertains probably more to ZEC than XMR). There is no doubt that if/when these two coins finally have their moment in the spotlight, they will go hard af. There is a lot of regulation uncertainty around privacy in general, which probably plays a role in the general hesitancy and lack of strength for these two coins.
Which to choose - Xmr is better from a purist point of a view, where Zec offers better pure privacy at the cost of several tradeoffs and has more centralization in its development and roadmap. Given Zec's availability on Coinbase and Gemini and its regulatory standing with the NYDFS, I chose Zcash to get the slightly larger allocation in my portfolio, but both coins are great. Having a small privacy allocation in your portfolio with a a 50/50 or 70/30 split for XMR/ZEC or vice versa is potentially a smart hedge for the scenario in my thesis.
Concluding thoughts - personally, I think buying privacy coins at this moment in time are a win-win. Either it's the trade of a generation and you look like a genius, or you become a member of a tight-knit cooperative and fun community for years to come
thoughts 2: should be obvious but to be claer- its a long shot to ever hit 0.10 plus again on the ratio, but something like .02 to .05 is certainly well within the range of outcomes
Disclaimer: This is not trading/investment advice


Zec/USDT - 1DayZcash is a decentralized cryptocurrency focused on privacy and anonymity. It uses the zk-SNARK zero-knowledge proof technology that allows nodes on the network to verify transactions without revealing any sensitive information about those transactions.
Contrary to a common misunderstanding, the majority of cryptocurrencies on the market, including Bitcoin (BTC), are not anonymous, but rather pseudonymous; while they do not explicitly reveal the identities of their users, each user has their own public address or addresses which can be traced back to them via the methods of data science and blockchain forensics.
Zcash transactions, on the other hand, still have to be relayed via a public blockchain, but unlike pseudonymous cryptocurrencies, ZEC transactions by default do not reveal the sending and receiving addresses or the amount being sent. There is an option, however, to reveal this data for the purposes of auditing or regulatory compliance.
Zcash was first released on October 28, 2016, and it was originally based on Bitcoin’s codebase. (CMC)

Zcash/USD Buy! Short To Medium-Term Trade OptionI've purchased $ZEC with the intent to sell at these 2 levels. When/if I get my capital invested back I'll keep the remaining Zcash on my ledger for long-term prosperity.
IMO, Coinbase aren't listing assets that are stinky... If you have an opinion that counters the one that I have made I am open to constructive criticism.
Trade safe and make bank x


Zcash formed bullish BAT for upto 59% profit rallyHi dear friends, hope you are well and welcome to the new update on Zcash coin.
On the daily time period chart, the price action of the ZEC with Bitcoin pair has completed bullish BAT and entered the potential reversal zone.
this trade has a profit possibility of 59% and the loss possibility is 7.93%.
Note: Above idea is for educational purpose only. It is advised to diversify and strictly follow the stop loss, and don't get stuck with trade.


OCEAN leading the way. LTC, TRX, ZEC to follow?As you can see on this analysis, we have OCEAN showing the way and no doubt the other 3 will follow suit.
Not much more to say really.
Happy trading legends!
HTBB


🔥Global trending Zcash ZEC/USDSupport the idea with like!❤️
#ZEC/USD
📌Global trending ZEC
🔹Analysis: The price has reached the global trend line, in my opinion this is a good point for a long, please note that the asset is moving in an expanding channel. I do not give exact points for entry-exit. Resistance lines - possible sell / correction, you can fix part of the position. All goals are shown on the chart. This is just my opinion, it may not coincide with yours.

ZECBTC long ideaafter making last two years ATH ZEC quickly dropped to the 0,00230 level area with the BTC falling down from 58K and accumulating around 0.0026x satoshi. According to the daily trendline its still bullish and has to recover the loses and first target is 0,0037x satoshi level.
