Zec

ZEC vs BTC --- LONG --- 20.10.20Still worth to try some SPOT buys as for me. Especially when I look at that rising volume
Unfortunatelly I don't think that SL below the local low will save the position, so it is better enter with smaller size. Not works for me, cuz im already in :)
Ofcourse if the price holds below the previous low - leave.

Zcash aiming $125 by early DecemberContext: ~31 days until Zcash's first halving
Since April 12th we've entered an ascending channel with consistent higher lows and higher highs. We've yet to revisit this year's $100 high set during early August, but instead, have seen action mainly concentrated between the $50-$75 range. There seems to be strong support at $50, but even stronger at $44.
Possible Short-Term Scenario: We can touch the established bottom trendline of the ascending channel (around $55) followed by a bounce towards the $125 range in about a month's time.
Possible Long-Term Scenario: Extremely bullish with Zcash. We revisit January 2018's ATH by the next year 2021. Zcash has the potential to peak out at $3,737 during the final phase of this upcoming bull run, maybe January 2022 or January 2023.

Fresh Short Signal for ZEC/BTCZcash BITFINEX:ZECBTC couldn't break long term resistance (thick red line) . Key support @0.00611 is broken and it possibly started a new downtrend.
Considering it sits right at 200EMA we can see a reaction but it's not for sure. Going below 21 EMA will be a stronger sign of downtrend.
Unless it goes above @0.00611 again I'll be shorting it.
Significant supports to watch:
0.005682
0.005285
0.004949
0.004686
0.004411
DISCLAIMER : Please note that my trading approach is trend following . I don't try to make predictions. I don't try to catch the bottom or the top. I don't try to be right. I try to be agile and flexible enough to join the right side before it's too late. Please also note that I'm a swing trader using daily charts .
Entry and exit signals are not universal in trading. They should be determined according to the trading method used. If your trading approach and my trading approach don't match, please do NOT consider them relevant for your own purposes.


ZCash looks done or close to done 💥Looks like we are done or close to done for most pairs.
Possibly one more push on some pairs like zcash

ZECUSDT ------->>> Andrews PitchForkHey guys
As shown in the chart, the price has crossed the middle line of the fork to increase the upper line of the fork.


ZEC Adam and Eve double bottomand currently forming the handle, of a cup and handle pattern. Target if breakout at $85

Zcash price prediction 2020-2025Among all the coins shooting into the stratosphere only to come crashing down, Zcash has remained surprisingly stable throughout this year. Zcash is solving the problem of anonymity faced by the Bitcoin community and its enhanced privacy feature is winning the hearts. Zcash value increased significantly as there were rumors that it will be enlisted on the Gemini exchange which is based in New York and owned by Cameron and Tyler Winklevoss (they have invested heavily on Zcash). Zcash's partnership with Ethereum helped to introduce ZK-snarks to the larger platform as part of the Byzantium upgrade. It also partnered with JPMorgan to introduce a zero-knowledge security layer (ZSL) into JPMorgan’s Quorum blockchain. These advancements led to Zcash’s appreciation in value, which can cross $200 mark by the end of 2020. (Zcash future 2020)
Zcash price prediction 2020
Zcash community might introduce many developments in the year 2020, which includes enhanced privacy system, which might attract many Bitcoin users over to Zcash, raising the demand for the coin. After the recently conducted vote at the Zcash Foundation, it was decided not to close the mining protocol for ASIC devices. Additionally, the governing board of the platform decided to change it later on and disclose it to potential equipment producers, so as to receive support from miners from various sides. Zcash may choose to change for multiple mining algorithms by 2020, this way the coin’s community will not be dependent only on GPU miners, even though they make up a significant part of the network. This advancement might lead to an establishment of a milestone for the Zcash community as the price might plunge high to around $200.
Zcash price prediction 2025
In a period of 5 years, Zcash might become globally popular, and its use case might populate as well. By 2020, Zcash could prove to be the “first globally accessible ‘offshore’ investment opportunity” as it has the ability to not only fill the void left by the declining offshore banking sector but even expand this opportunity to everyone — not just wealthy elites. This engagement might alleviate the Zcash price significantly if the asset can capture even a small percentage of the wealth which is currently stored in offshore accounts. As this is going to be a big stepping stone for Zcash to grab the top 10 spots in the ranking system, it might outsmart its fellow-altcoins. By 2025, Zcash price might exponentially increase to around $1242. (Zcash future potential).

ZECUSDtaking a look at zecusd on the 4hr. looks to me as if cup and handle has formed.
aggressive buy would be the handle breakout
or wait for break of the cup. keep stops in place trade on.

ZEC.12h. Purchasing zone $42.5.In half a year, one of the old crypto coins ZEC made x6 .
The only significant news on the horizon of ZEC is the mid-November halving.
It seems that ZEC is traded only by those who mine it and then sell it on the market.
Perhaps, they will be interested in this idea.
Now, we assume a fall of ZEC price to $42.5.
And from this level, we can expect a rebound to $75 , in anticipation of halving.
_____________________
Each " like under the idea" boosts the level of our happiness by 0.05% . If we help you to be calmer and richer - help us to be happier :)

Is Z Cash finally showing a semblance of a comeback? ZECUSDWell I think so. At least for while we are in what appears to me to be Wave 5 with two subfractals. I am bullish on this one currently. I never short second sub waves, and almost never subwaves 4. Anyway, do your research - this is not financial advice ffs.
Scalping Trade. Be on the chart!I expect a correction like this! To have a strategy to exit ... the market is emotional. Leverage less than 5% and eyes on the chart. Thank God. Good luck.

ZEC/BTCWe are sitting at very strong support for Zcash. Reasonable time to start a position if you're not in it already.
I see two paths for Zcash.
1. One more leg down if it can't break the diagonal trendline. Best be buying 3800-4000 satoshi range, this is around where Zcash bounced big earlier this year.
2. Breaks the trendline and we get back to summer highs.
I'm leaning towards option 2, as the ZEC halving in 2.5 months-ish seems to be the narrative here. Option 1 if the market stabilizes and BTC dominance continues its trip south.

ZEC/USD - ATS SWING BACKTESTScript settings for 8H timeframe:
· Signal calculation type - "open"
-TP for Long - 28%
-SL for Long - 9%
-TP for Short - 28%
-SL for Short - none

Bullish on ZECAfter dropping from the ABCDE triangle not too long ago, I believe the latest green candles are a part of something new and exciting. Anyway, I longed ZEC!

Z Cash Going Down! ZECUSDLooks like we are zigzagging this one. There was a very small 5th wave that passed, meaning we are due for more drops.
Target's marked in red, Fib time indicates roughly when it might happen. It's drop, drop, drop time for this big boy.


ZECUSD: Downtrend (11.09.2020)On D1, the cloud is directing downward, indicating a downtrend.
On H4, the price fluctuates around the cloud, which indicates the formation of a correction.
Besides, on H4 and H1, the correction model in the form of a triangle is visually well visible.
We recommend selling on the breakdown of the downward correction model boundaries, or in case of false growth to the level of 68 (when RSI will reached overbought level on H1 and H4).

ZECUSDT Looks Really Strong 100% Growth PotentialWe have seen a good rally in ZEC Since its major drop in march
as of now it has turned its previous high of Feb into a support now after making a new Higher High in Aug as compared to Feb with Higher Low which indicates a good bullish momentum.
The price are trading above EMA 50, 100, 200 on Daily Time frame and it adds another boost to its momentum.
RSI and MACD are also Showing good signs of Upward Trends.
The potential TP's are marked in the Chart.
TP1 - 110
TP2 - 150
TP3 - 175
Open
SL Manually Daily Close below EMA100
This is not a financial advice.
DYOR
Thanks
Aanuj Tated.

ZEC/BTC (Major Support Tested?)BINANCE: ZECBTC
-Zcash tested the previous resistance and support area at 5200 sat
-We can see multiple candle rejections in this zone
-This is a Bullish sign but not yet confirmed
-We need to see a break of the trendline resistance
-To confirm that the downtrend is likely over
-And the dominant trend will continue higher
-Not financial advice, please exercise proper risk management
^Trading involves High Risk
^Not Financial Advice
^Please exercise Risk Management
**If you like my daily Published Ideas
**Please don't forget to leave a thumbs up & comment
**Thank you! :)

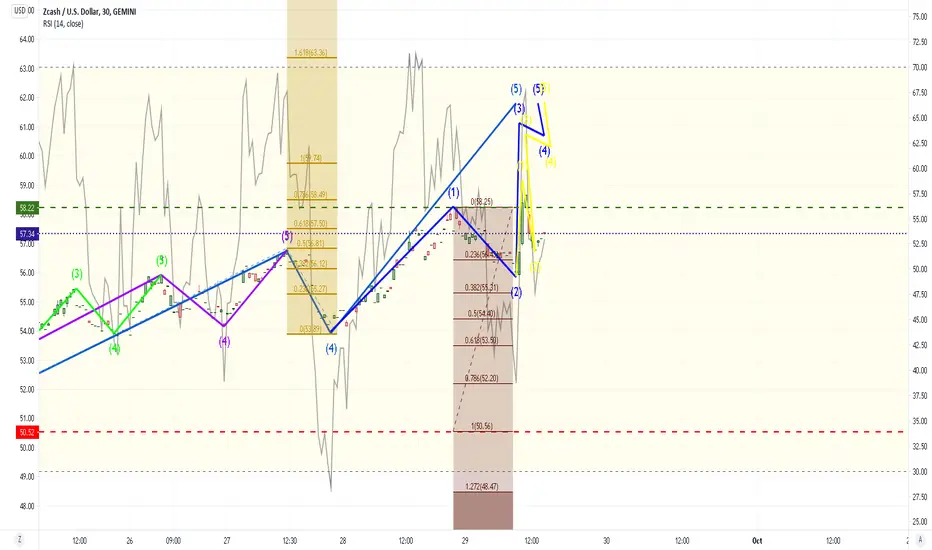
Zcash can give us %30 Profit with just Fibo levels + 50/200 MASometimes we focus on too much details and forgot basic fundementals..
- Here we have 200 days MA work as good support. The last time price go below 200 MA was in 10th March took just 1 month.. 200 days moving average is key level for ZEC.
- Sto RSI started to turn out positive
- Price was at the highest $102,74 on 6th August ( Top price)
- Price was at the lowest $56,77 on 3rd September ( possible bottom)
I setup Fibonacci on these levels and i noticed Fibo 0.5 level was equal to 50 days moving average. I think we may sell some sell opportunutiy here.
- We can gain possible %30 profit from $61 to $76 .
Risk reward ratio is 2.75
Stop loss level i put $50.56
Please read this first !
This post does not provide financial advice. It is for educational purposes only! You can use the information from the post to make your own trading plan for the market. But you must do your own research and use it as the priority. Trading is risky, and it is not suitable for everyone. Only you can be responsible for your trading.
Regards
