ZECUSD - Rejection by Trend Line and Resistance LevelAs with many coins out there right now, Zcash also has a long descending trend line proving troublesome to break. Recent events with ZEC have proven this to be true once again.
Price has recently tested this trend line whilst at the same time being rejected by resistance levels at around $48-$50.
We do have a nice support line on the underside which should be used as a target for this short, offering well over 10% in gains on this trade.
If you enjoyed or agree with this idea - drop us a comment, like & follow! :)
Zecshort

ZCASH dump💥 loading 99% I think it's time to short ZEC and don't miss to set your SL above 46.6$ and set 2X-3X leverage.

ZECUSDT Buy signal ZECUSDT Buy signal on 2D Timeframe
The signal on this chart is typically very strong
..........................................................

zecusdtHello traders,
I think in this situation we should wait for the triangle to be broken in the one-hour time frame in order to have a safe entry.
Confirmation is very important in the one-hour timeframe


I SEE ZEC PULLING DOWN TO $160 ZONE SOONlooking at my analysis, I would say ZEC has the potential of coming down to $160 zone soon.
A rally may follow this fall if all things are equal. this may happen before another rally within the triangle.
KINDLY, Like, Comment, Follow and criticize.

$ZEC Long-term Trend = PT Sub $100?Zcash continues to reflect bearish decline in spite of the wildly volatile price action.
Trendline indicates sub $100 PT remains valid, although $240 is within reach & flirting with $260 is not unrealistic.
Solid opportunities for momentum trading long & short positions.

ZEC ready to dump! BE PREPAREDZEC has had one incredible run up to the T200 mark.
However, as I stated in a previous video today: ZEC poised to be trapped within it's descending triangle from over this past year. Zcash is in a historic downtrend right now.
-Note the RSI in purple at the bottom of the screen
-As I pull back to look at the daily ticker, you will notice that the strength index has progressively gotten more and more saturated throughout this hyper positive trend
-Any RSI that saturated and just... straight-up -wettt- is going to finally get overstimulated enough to want to tap-out.
New traders : MAKE SURE you take the time every once in a while to pull back on a daily or even weekly ticker and ident your positive or negative overall trends for a token.


ZEC DESCENDING UPPER TRIANGLE PATTERN!Hi! this is my ZEC/USDT IDEA
I got a feeling we will see a breakout soonl.
Hope you will like it! if
you have any feedback about the chart pls feel free to tell me:)
MY IDEA ONLY NOT A FINANCIAL ADVICE!!!
Love Yall :)

Miss out on Zcash's last pump? It's not too late. ZEC is a buy today after its fall from grace at $120. Think of this as a second chance to get in cheap! This is a massive buy signal on the daily chart.
Disclaimer:
Not Investment Advice
The information provided by Trading Legacy is for general information purposes only. No information, materials, services and other content provided by Trading Legacy constitutes solicitation, recommendation, endorsement or any financial, investment, or other advice. Seek independent professional consultation in the form of legal, financial, and fiscal advice before making any investment decision.

ZEC in a beautiful canalZec is in a very beautiful canal which is very clear. There we are in a triangle or we must wait if it comes out from the bottom or the top.
If it comes out the bottom then TP: $ 75
If it is from the top:
TP: $ 127
And if we break the canal from the top, it's: $152
If you like and want a update please give me : a thumbs up ;)
Good trade for all !


ZECUSD: Good opportunity for LongAt D1, the cloud is directing upward, indicating an uptrend. The RSI moved down and the price found support on the Ichimoku cloud.
At H4, the cloud is directing downward, indicating a price correction at the D1 timeframe.
Besides, RSI is at the oversold level, which indicates the weakness of sellers.
We recommend buying ZECUSDT near the 50% Fibonacci level and take the profit near the level of 108.

ZECUSD: Analysis using Ichimoku 30/06/2020H4
On D1, the cloud is directing upward, indicating an uptrend.
Conclusion:
Locally, we recommend buying when the RSI reaches an oversold level on the H4.
H1
At H4, the cloud is directing downward, indicating a downtrend.
Conclusion:
Locally, we recommend selling when the RSI reaches an overbought level on the H1.

ZEC: NEO: Analysis using Ichimoku 06/06/2020H4
The price of ZEC is slowly dropping to the Ichimoku cloud, indicating a local correction.
RSI is in an undefined state.
Conclusion:
Visually viewed local correction. We recommend buying from key Fibonacci support levels of 61.8% and 50%
H1
The price fluctuates around the Ichimoku cloud, indicating a local correction.
RSI is committed to overselling level.
Conclusion:
We recommend buying from key Fibonacci support levels of 61.8% and 50%, as well as when the RSI is come to overselling level.
Good luck!

Zcash( $ZEC ) Technical Analysis: 01/02/2020 - #ZECUSD chartZcash( $ZEC ) Technical Analysis: 01/02/2020 - #ZECUSD chart

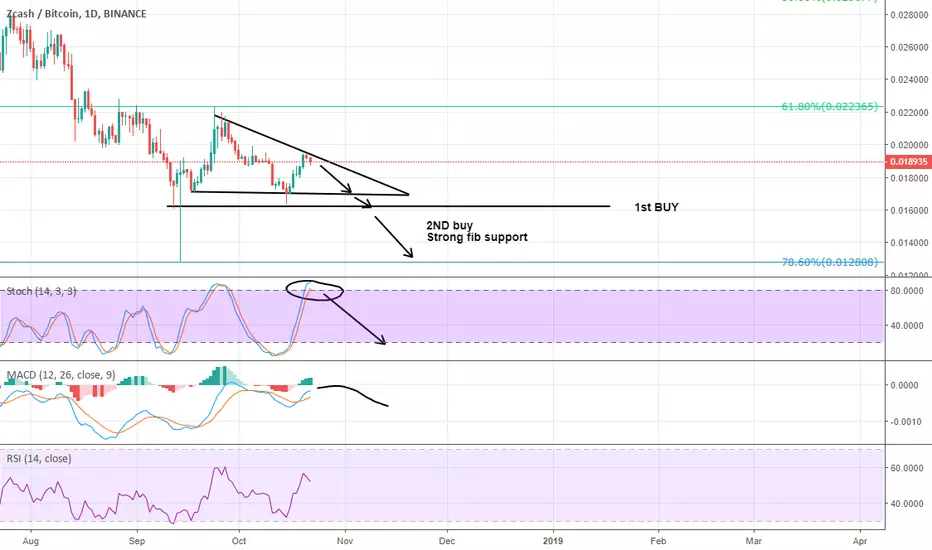
ZEC BTC BEST BUY ENTRY POINTS
Zec against BTC now is situated into a Triangle where:
-Stoch is overbought 89+ and soon will be a bearish divergence here
-MACD it-s still in negative zone,they have room to go up till neutral zone(0) is bearish
-RSI 52 and still droping
Wait for LONG ENTRY:
IF BTC make a breakdown we will have the opportunity to entry long in zec at these supports:
1) 0.016000 sats is a strong 1D support.
2) 0.012000 sats for a nice double bottom ,this is also a fibonaci 78.60% support
IF BTC will going up,we will entry at 0.0169 which is the resistance of triangle
In any case,they will drop
ZEC. Price will be $ 100. soonThe main price zone of 175-185 $, from which all the powerful upward movement began, was broken down. Within 2 weeks, buyers were not able to return this zone to themselves. Between the price zones 95-105 $ and 175-185 $ there is no liquidity. This will allow the price to easily reach my target.

ZECUSD Following the BTC
Following the BTC
We are waiting for the test of the level of price imbalance ZEC USD. Support is expected in the region of $ 130, after which there will be a pullback of the price to the top, a retest of the support level and two options for the development of events: the scrapping of the bearish trend or its continuation. All moving averages are bearish.
We are waiting for good bullish volumes and a break in the trend, there will be a good entrance to the market. All good trades

ZEC trendZEC Could break out soon..
Follow the channel to short through the rise.
Warning: If BTC falls it could either drag it down, or BTC investors could pour into alt coins and cause them to rise.
Trade safely my friends.
