ZECUSD Looking very bullish and mimicking previous move to the here I've pointed out the exact resemblance of previous move with ZEC/USD and what we can see it these are almost picture perfect from where we are at this exact moment take a look for yourself
disclaimer -- this is for educational purposes only
ZECUSD

ZECUSD Forecast: 37.29% IncreaseExpect ZCash to increase 37.29% with a take profit at 255.00.
Price closed above trend line, ema 10, and ema 20. Enter price at 185.74 which is the closing price of the candlestick.

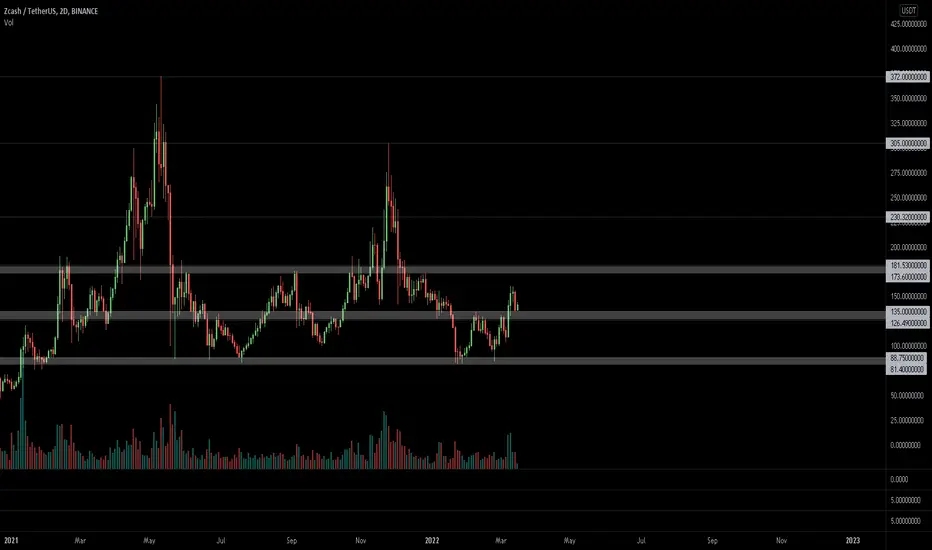
$ZEC, Trying to go for a flip over ~130$ area$ZEC
Trying to go for a flip over ~130$ area
UCTS bullish on the 1D & 2D timeframes (usually strong)
If gets traction from here then 180$ seems feasible
#ZEC
ZEC ready to dump! BE PREPAREDZEC has had one incredible run up to the T200 mark.
However, as I stated in a previous video today: ZEC poised to be trapped within it's descending triangle from over this past year. Zcash is in a historic downtrend right now.
-Note the RSI in purple at the bottom of the screen
-As I pull back to look at the daily ticker, you will notice that the strength index has progressively gotten more and more saturated throughout this hyper positive trend
-Any RSI that saturated and just... straight-up -wettt- is going to finally get overstimulated enough to want to tap-out.
New traders : MAKE SURE you take the time every once in a while to pull back on a daily or even weekly ticker and ident your positive or negative overall trends for a token.

🚨 ZEC Beware 🚨 @~T200 Quick video detailing the fact that ZEC will meet strong resistance once meeting the downward trend at some point in the coming months.
(ZEC will drop back to it's weekly pivot)
Make sure, before you start poppin' cherries on hot tokens you'd never charted/hadn't charted in a while, look back at the daily and make sure you're not going to get shanked at the historic down-trend.

ZECUSD attempting double bottom breakout. $196 possible target. Luna completed it’s double bottom breakout with ease, and considering we only just recently shifted back into an uptrend I’m assuming this double bottom as well as several other cryptos double bottom patterns are likely to trigger as well. Of course, as always we should wait for confirmation of a bullish breakout from this pattern, not go off assumptions, and currently the price action is finding resistance upon testing the double bottom neckline. Once it flips it to solidified support and then we see a nice impulse of bullish volume afterwards we can be more confident that it will validate the breakout. If so the target is $196. *not financial advice* Until then this idea will have to be listed as neutral despite myself having a bias towards the bullish outcome.

Zcash Reversal Rally potential on Low Time FrameA purely peer-to-peer version of electronic cash would allow online
payments to be sent directly from one party to another without going through a
financial institution.
Digital signatures provide part of the solution, but the main
benefits are lost if a trusted third party is still required to prevent double-spending.
We propose a solution to the double-spending problem using a peer-to-peer network.
The network timestamps transactions by hashing them into an ongoing chain of
hash-based proof-of-work, forming a record that cannot be changed without redoing
the proof-of-work.
The longest chain not only serves as proof of the sequence of
events witnessed, but proof that it came from the largest pool of CPU power. As
long as a majority of CPU power is controlled by nodes that are not cooperating to
attack the network, they'll generate the longest chain and outpace attackers.
The network itself requires minimal structure. Messages are broadcast on a best effort
basis, and nodes can leave and rejoin the network at will, accepting the longest
proof-of-work chain as proof of what happened while they were gone.

Zcash vs Bitcoin must avoid the 1D Death Cross!Zcash is an implementation of the Decentralized Anonymous Payment scheme Zerocash, with security xes and improvements to performance and functionality.
It bridges the existing transparent payment scheme used by Bitcoin with a shielded payment scheme secured by zero-knowledge succinct non-interactive arguments of knowledge (zk-SNARKs).
It attempted to address the problem of mining centralization by use of the Equihash memory-hard proof-of-work algorithm.
ZEC ready to complete 3 pushesEverything clear on the chart, we are having a bearish channel in an uptrend which 75% of the time will make a bullish flag and continue with trend, on the other hand the bearish channel is looking like a falling wedge ready to break with a nice signal bar.
NFA

Zcash (ZEC) - March 23Hello?
Traders, welcome.
If you "follow", you can always get new information quickly.
Please also click "Like".
Have a good day.
-------------------------------------
(ZECUSD 1W Chart)
(Full: )
We need to see if we can break out of the two downtrend lines while maintaining the price above the 162.04 point.
A move above the 239.40 point is expected to accelerate the uptrend.
You need to see if it is moving higher than the two downtrend lines around the week that includes the 25th of April.
-------------------------------------
(ZECUSDT 1D Chart)
Resistance range: 209.6-232.7
Support section: 94.0-117.1
However, it is important to keep the price above the 163.4 point to continue the uptrend.
-------------------------------------
(ZECBTC 1W chart)
Above the 0.004341-0.005954 interval: Expect an upward trend reversal
Above 0.008700 point: Expected to create a new wave.
However, it is important to get support above the 0.003299 point in order to break out of the 0.002058-0.004650 section, which is the bottom section.
------------------------------------------------------------ -------------------------------------------
** All indicators are lagging indicators.
Therefore, it is important to be aware that the indicator moves accordingly with the movement of price and volume.
However, for convenience, we are talking in reverse for the interpretation of the indicator.
** The MRHAB-O and MRHAB-B indicators used in the chart are indicators of our channel that have not been released yet.
(Since it was not disclosed, you can use this chart without any restrictions by sharing this chart and copying and pasting the indicators.)
** The wRSI_SR indicator is an indicator created by adding settings and options to the existing Stochastic RSI indicator.
Therefore, the interpretation is the same as the traditional Stochastic RSI indicator. (K, D line -> R, S line)
** The OBV indicator was re-created by applying a formula to the DepthHouse Trading indicator, an indicator disclosed by oh92. (Thanks for this.)
** Support or resistance is based on the closing price of the 1D chart.
** All descriptions are for reference only and do not guarantee a profit or loss in investment.
(Short-term Stop Loss can be said to be a point where profit and loss can be preserved or additional entry can be made through split trading. It is a short-term investment perspective.)
---------------------------------

Long Grayscale Zcash Investment Trust, soon to be a Zcash ETFThis is a no-brainer. my actual entries are $13.75 so this is a late push on trading view breakout

ZEC/USD Main trend (part). Anonymous cryptocurrencyAnother anonymous cryptocurrency with at least some liquidity.
Main trend (part). Timeframe 1 week to understand what happens in the main trend.
After pumping and reaching the goal of $380 (marked earlier), the pullback and the formation of a harmonious butterfly pattern. At the moment the price is in the formation of its second part. The figures marked the potential entry points, depending on your trading strategy and the market situation that arises during the development of the trend in the future.
It is rational to enter the market on the breakdown or rollback after the breakdown of the descending line of the secondary trend, which is resistance of the second part of the harmonic figure. Another option is to dial in parts from the zones of support levels by martingale. When working with this method correctly distribute the volume of potential entry in advance, remember the main thing is the average price of the set, and not to buy off the "bottom".
At a reversal on the undersized amount you can on a breakdown or rollback after the breakdown of the downtrend (if the price has not taken off considerably) to get the position by the pyramiding method, but it is not obligatory.
In very hard times, for very "fat wallets" (not cryptocurrency) like most of anonymous cryptocurrencies, it is very likely that "pumping with stick" will take place in a moment... when there will be "saving money."
Previous closed trade idea for this cryptocurrency: From and to. 51-380
ZEC/USD Main Trend. Breakout. Butterfly. Downtrend triangle
ZEC/USD Local work. Downtrend triangle. Pivot zone

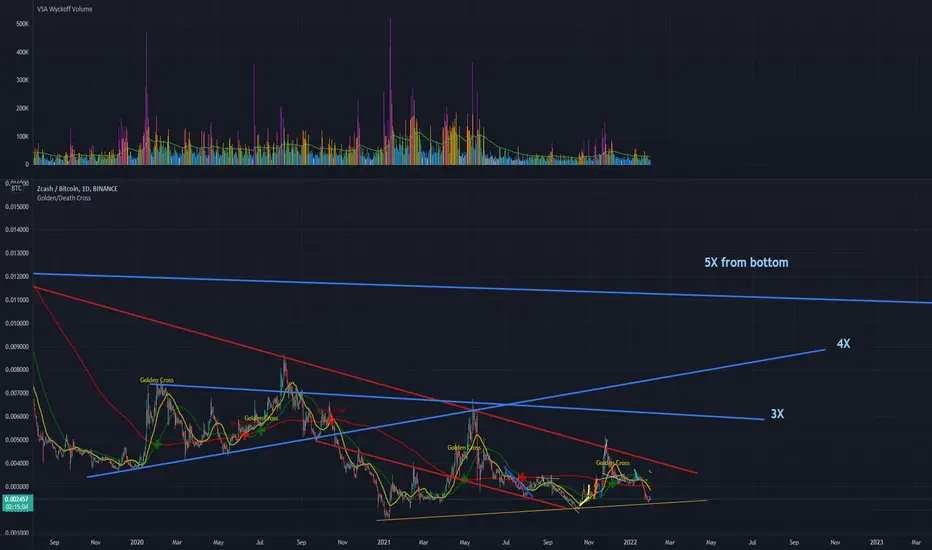
Binance Market - Zcash vs Bitcoin - double bottom reversalMaximum near term target is 10X from the local bottom which about 0.019000
the 5X target looks more reasonable 0.0110000
less ambitious targets also relevant. Primary drivers are the supply shock squeeze, and whether or not Robinhood App includes Zcash in its new set of crypto asset markets.
Its already got access to the #2 and #3 FOMO apps which are WeBull and Public.com

ZEC Bearish Zec looks bearish as it has approached some key resistance.
Id be looking at areas such as 171 to start taking profit from the short

#ZECThere has been an uptrend since January 24. The level of $125 was strong, but we managed to consolidate higher.
The next very serious resistance line will be at $190. If we consolidate above it, I expect a strong growth.

ZEC 8h market mapKey points:
- Change of behaviour (Higher highs and lows).
- Volume breakout.
- Price above median line.
- Started the uptrend before BTC and ETH.
Will ZEC outperform BTC & ETH?
Highly possible.
Good luck all.


ZEC is coming down to $150I see ZEC retracing from the recent over $178 down to $150 before any other rally may happen.

ZEC Weekly StudyLet's see how this goes.
Min: 800 USD
--> previous ATH
Long Term Target: 30.000 USD
--> halvings, proof of work, ecc, privacy as a public good, human rights, inflation ++ narratives.

ZECUSDTI want to see correction at this level followed by a strong breakout from it with volume to say that ZCash finished its bearish market and will start to record new highs
target is highlighted
Zecash broke out of the ascending triangle..And retested it.
Beautiful price action, 140-145 has to hold to move further.
200+ incomming? Privacy coins are hot now.

Take Profit: 170.34 (ZECUSD)Entry after price closed above support resistance level. Second entry on the retest of support resistance level.

low time-frame ZEC scalpalthogh price has been in a local uptrend , I notice a massive selling volume on BTC pair. if BTC doesnt go up unexpectedly we can expect a minor decline in ZECUSDT.
MAKE SURE YOU FOLLOW OUR CONTENT ON ALL PLATFORMS.
