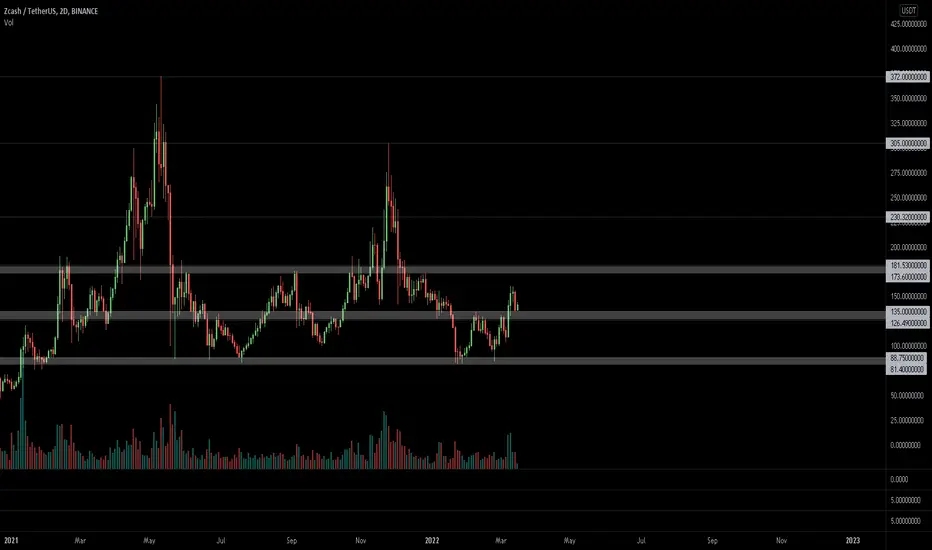
$ZEC, Trying to go for a flip over ~130$ area$ZEC
Trying to go for a flip over ~130$ area
UCTS bullish on the 1D & 2D timeframes (usually strong)
If gets traction from here then 180$ seems feasible
#ZEC
ZECUSDT
ZEC ready to dump! BE PREPAREDZEC has had one incredible run up to the T200 mark.
However, as I stated in a previous video today: ZEC poised to be trapped within it's descending triangle from over this past year. Zcash is in a historic downtrend right now.
-Note the RSI in purple at the bottom of the screen
-As I pull back to look at the daily ticker, you will notice that the strength index has progressively gotten more and more saturated throughout this hyper positive trend
-Any RSI that saturated and just... straight-up -wettt- is going to finally get overstimulated enough to want to tap-out.
New traders : MAKE SURE you take the time every once in a while to pull back on a daily or even weekly ticker and ident your positive or negative overall trends for a token.

🚨 ZEC Beware 🚨 @~T200 Quick video detailing the fact that ZEC will meet strong resistance once meeting the downward trend at some point in the coming months.
(ZEC will drop back to it's weekly pivot)
Make sure, before you start poppin' cherries on hot tokens you'd never charted/hadn't charted in a while, look back at the daily and make sure you're not going to get shanked at the historic down-trend.

XMR bursts through the resistance trend!! ~204 to ~208Discussing XMR breaking through the trend to hopefully give us another nice pump up to the first resistance pivot
also discussing ZEC at the end, and the fact that ZEC is on a historical downward trend.
EDIT 03/24/22 @1805hrs MDT just noticed in my little ZEC analysis that historically, ZEC is forming a nice little triangle breakout with my bottom trend line. I think I am going to follow this, chart it some more and see where it goes. Happy trading everyone! ALSO: NOTICE XMR's HISTORIC VOLUME.... 🛫☁☀️👆

ZEC ready to complete 3 pushesEverything clear on the chart, we are having a bearish channel in an uptrend which 75% of the time will make a bullish flag and continue with trend, on the other hand the bearish channel is looking like a falling wedge ready to break with a nice signal bar.
NFA

Zcash (ZEC) - March 23Hello?
Traders, welcome.
If you "follow", you can always get new information quickly.
Please also click "Like".
Have a good day.
-------------------------------------
(ZECUSD 1W Chart)
(Full: )
We need to see if we can break out of the two downtrend lines while maintaining the price above the 162.04 point.
A move above the 239.40 point is expected to accelerate the uptrend.
You need to see if it is moving higher than the two downtrend lines around the week that includes the 25th of April.
-------------------------------------
(ZECUSDT 1D Chart)
Resistance range: 209.6-232.7
Support section: 94.0-117.1
However, it is important to keep the price above the 163.4 point to continue the uptrend.
-------------------------------------
(ZECBTC 1W chart)
Above the 0.004341-0.005954 interval: Expect an upward trend reversal
Above 0.008700 point: Expected to create a new wave.
However, it is important to get support above the 0.003299 point in order to break out of the 0.002058-0.004650 section, which is the bottom section.
------------------------------------------------------------ -------------------------------------------
** All indicators are lagging indicators.
Therefore, it is important to be aware that the indicator moves accordingly with the movement of price and volume.
However, for convenience, we are talking in reverse for the interpretation of the indicator.
** The MRHAB-O and MRHAB-B indicators used in the chart are indicators of our channel that have not been released yet.
(Since it was not disclosed, you can use this chart without any restrictions by sharing this chart and copying and pasting the indicators.)
** The wRSI_SR indicator is an indicator created by adding settings and options to the existing Stochastic RSI indicator.
Therefore, the interpretation is the same as the traditional Stochastic RSI indicator. (K, D line -> R, S line)
** The OBV indicator was re-created by applying a formula to the DepthHouse Trading indicator, an indicator disclosed by oh92. (Thanks for this.)
** Support or resistance is based on the closing price of the 1D chart.
** All descriptions are for reference only and do not guarantee a profit or loss in investment.
(Short-term Stop Loss can be said to be a point where profit and loss can be preserved or additional entry can be made through split trading. It is a short-term investment perspective.)
---------------------------------

Bullish div & support ZEC weeklyWeekly:
Weekly bar closed high and gives us a bullish divergence, including a bounce off of support. Entry around 126 (wait for a pullback on a shorter timeframe).
A bottom has been formed and the weekly bar closed positively, showing a strong rejection of that support level and stochastic RSI came from an oversold condition, now curling up from this condition.
After the bullish divergence on the daily, see previous trade that worked out very well that downtrend seems to reverse
Entry: 126-128,5
SL: 102 (will move it up)
TP1: 177 (resistance)
TP2: 180 (1 ATR level, or higher, I'll let this remainder run probably with a trailing stop)
2022#003

ZEC/USD Main trend (part). Anonymous cryptocurrencyAnother anonymous cryptocurrency with at least some liquidity.
Main trend (part). Timeframe 1 week to understand what happens in the main trend.
After pumping and reaching the goal of $380 (marked earlier), the pullback and the formation of a harmonious butterfly pattern. At the moment the price is in the formation of its second part. The figures marked the potential entry points, depending on your trading strategy and the market situation that arises during the development of the trend in the future.
It is rational to enter the market on the breakdown or rollback after the breakdown of the descending line of the secondary trend, which is resistance of the second part of the harmonic figure. Another option is to dial in parts from the zones of support levels by martingale. When working with this method correctly distribute the volume of potential entry in advance, remember the main thing is the average price of the set, and not to buy off the "bottom".
At a reversal on the undersized amount you can on a breakdown or rollback after the breakdown of the downtrend (if the price has not taken off considerably) to get the position by the pyramiding method, but it is not obligatory.
In very hard times, for very "fat wallets" (not cryptocurrency) like most of anonymous cryptocurrencies, it is very likely that "pumping with stick" will take place in a moment... when there will be "saving money."
Previous closed trade idea for this cryptocurrency: From and to. 51-380
ZEC/USD Main Trend. Breakout. Butterfly. Downtrend triangle
ZEC/USD Local work. Downtrend triangle. Pivot zone

ZEC / USDTAs you can see in the chart ZEC was rejected by the resistance, keep eye on the chart and wait for the confirmation to make it short or long
Just follow the line that I draw
DO NOT FORGET TO USE STOP LOSS BEFORE ENTERING THE MARKET
This is not financial advice it's just my opinion sharing with you guys / Before entering the market DOUBLE CHECK IT and do trading based on your own strategy
I do trading based on Patterns and Zone by Zone / Find your own way that suits you

ZEC 62% setupZEC will get network update this april. Cumulative delta in positive right now, we can see huge purchases clusters.
All the anon cash segment is alive right now. ZEC is old and heavy project, so it's hard to pump.
I expected $180 target, but at this moment $200 and $220 looks possible.
If you are interested in anon cash, check TORN project. It's new and easy to pump, so we will see more volatility and more profits there.

ZEC is coming down to $150I see ZEC retracing from the recent over $178 down to $150 before any other rally may happen.

btcusdtperpBitcoin is expected to make the move
Because the news that was published yesterday will probably correct the price for a short time

ZEC Weekly StudyLet's see how this goes.
Min: 800 USD
--> previous ATH
Long Term Target: 30.000 USD
--> halvings, proof of work, ecc, privacy as a public good, human rights, inflation ++ narratives.


Zcash shortZcash broke trough the ascending trendline. Asset broke trough the support level. Bearish movement to support level at 113 is expected to happen.

Zcash shortZcash broke trough the ascending trendline. Asset broke trough the support level. Bearish movement to support level at 112.6 is expected to happen.

ZECUSDTHello Crypto Lovers,
Mars Signals team wishes you high profits.
We are in the daily time frame. The price broke its resistance line and after a small pullback, it moved up strongly to the next resistance zone. The price can move down to the confluence of two supports and it will range between these two areas.
Warning: This is just a suggestion and we do not guarantee profits. We advise you to analyze the chart before opening any positions.
Wish you luck


ZEC finishing drop. ElliotZEC ended wave 4 of correction now entering the last wave of C, final push to the down
Wave number V should have 5 waves in it
invalidation above red line, expecting to go to 90ish

#ZECUSDTClamped above the serious level of $125. This level has now become a strong support line. The next strong resistance line is $190.

ZECUSDTI want to see correction at this level followed by a strong breakout from it with volume to say that ZCash finished its bearish market and will start to record new highs
target is highlighted