Zee Entertainment Short Term Breakdown + Reversal The stock has broken down but found support near 175. Trade is supported by brokerage calls and Supports Nearby.
Risk Reward Ratio - 2:1
SL is placed below the support zone. The target is placed based on fundamentals and previous swing high.
ZEEL

Zeel in the verge of breakout either wayZeel has formed a triangle pattern and trading at long term support 200. If broken can move at any direction violently.


Zeel has Breakdown 15min TF for TOMORROWZeel has Breakdown 15min TF
Nice moment from somedays. But today sideways and closes after breakdown at 15min TF. Downtrending structure with LL LH.
It is a conversion from positive to negative because LL LH formation has started from today.
Area between 227 to 226 has a support but very close to 224.60 nice swing is here.
So here after breakdown of 224.60 we will sell it.
Below 224.60 we can take sell trade. 1st Target 222 & 2nd Target 219

Zeel long in short termZeel has shown good strength and given a small breakout.
On daily chart is has made a very bullish candle taking support from its 200 EMA.
BUY - 214+
Target - 230 (1-3 days)

Zeel is looking bullish on Perallel supportZeel is looking bullish as on Parallel support. Major support is 175 If sustain above 190-195 it will touch 250 in coming days

Zee entertainmentZee at currents is a good buy for 1 to 2 yrs point of view, for trading purpose above 200 can go to 220 levels.

Zeel accumulate for long term investment Zeel is in an accumulation phase. Wait for retesting for long term investment at levels of 156.. 135..114 sl 114.
Once it breakout 250 then it will increase the pace.
Views are just for learning purposes.
NSE:ZEEL

Long ZeelGo long on Zeel, breakout given from the previous downtrend/
Buy at CMP SL 182 for targets 205-210-220

ZEEL - Low RIsk EntryZEEL is trading in a Bullish Channel Pattern for the last 1 year and taking strong Support at the confluence of its Channel Trendline and Horizontal Support Zone. The formation of Doji's for two consecutive weeks shows a strong fight between Buyers and Sellers.
If up move starts, we can see a target of 230+ within few weeks with a stop below 170.
On Daily timeframe, it has given a Strong Breakout above Resistance Trendline of a Bullish Falling Wedge pattern with Volume and showing strong signs of a Reversal to the short-term Bearish trend.

long term opportunityhave a nice weekly trendline break along with a W pattern
trendline is broke and retesting forming a head&shoulder pattern
after forming this right shoulder it should probably start up move
currently the probabilities are it is starting to form the right shoulder


ZEEL intraday for 23/04/21intraday position for NSE:ZEEL
disclaimer: education purposes only and not for trades.
each line has its instruction.

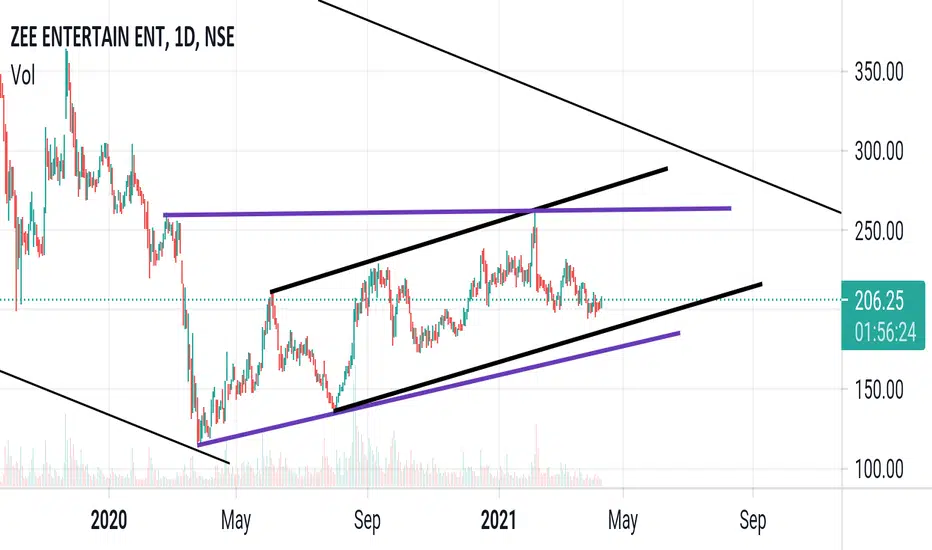
ZeelZeel looks good add 70% at cmp and add 30% of capital at 192 if it comes ,forming parallelchannel pattern ,targets could be260,290
Zeel All key levels are mentioned in chart
Disclaimer
I am not sebi registered analyst
My studies are Educational purpose only
Consult with your Financial advisor before trading or investing

ZEEL -- on Major support - Break? On Weekly timeframe - ZEEL is standing on major support line and good possibility to bounce back.
However based on market trend incase breaks the trend line - good possibility of shorting.
Look out for 180 PE(5/-) or 220 CE (7/-)


BIG BREAKOUT COMING IN ZEE ENT.(ZEEL)PLEASE SEE CHART FOR FURTHER DETAILS
TARGET 1: 310
TARGET 2: 370
STOP LOSS : 200
**These are my personal observations. Please trade at your own risk.**

ZEELBUY above 239-240 BREAKOUT
ZEEL is weekly breakout
this is retracement entry wait
stoploss your choice for intraday


ZeeLZeel is looking bullish, all the supports and resistance with a good trend analysis is shown in the charts. If the support @210 is broken then there can be a reversal of the trend, as of now it is taking @210 as support(Day closing basis).
Disclaimer: Please check with your analysis before investment- It is only for educational purpose only and solely based on my view.
