Reversal bullish is happening! No more boozy dancePEPPERSTONE:HK50
HSI:HSI
Hello everyone how was your trade since last update?
HSI turned bullish as forecasted from chart during my holidays!
Did you managed to gain some pocket money? I did with intermittent networks.
Let's review the Index action from wider tf; for the upcoming bull run.
1W Chart
For the week of 3 Feb 2025 the Index clocked a 1000pts +~5% gain. with this the W Chart had confirmed that the MACD formed GoldenCross with dark green histogram(with high volume)
19780 turned strong support level from resistance.
22760 the next resistance level to achieve and break the last Sept 2024 High.
Cross-checked with broader tf chart - D chart.
D chart on 27Jan2025
D chart today 11Feb2025
MACD break above zero level on 28Jan2025; confirming the Index turning bullish. The bullish continues since then till today!
KDJ is now at bullish zone but overbought.
MACD are still below zero level but seems arching and inching to break zero level to give confirmation of bullish.
Look at the 4H chart
There was a Golden cross formed on 3Feb2025 & 7Feb2025 (of course during these 4 days there was a slight adjustment on 5Feb2025 which probably the 🐳 flush retailers out).
MACD - still on the bullish zone but with reduced volume with light green histogram.
KDJ - Bullish zone with overbought zone above 80 level/
BB - Ranging at upper BB channel and continue to arching up.
Look at the 1H chart.
MACD is curving down (within bullish zone above zero level)
KDJ is in the bearish red zone almost entering oversold level of 20; wait for bullish reversal.
BB : crossed below middle line entering lower BB 21270 - 21470
Lower BB : 21265 (support level)
For day trade: Same strategy, sell at resistance; buy/TP at support.
Monitor the 1H,4H movement with confirmation using MACD & KDJ indicator.
Set your tf, have your entry and exit plan!
Get in the Golden cross and ride on the wave.
Support : 21250 ( next support level 21090)
Resistance : 21700 (if breaks then to retest the next resistance at 21955)
It needs to be stay above 21540 to bbreak the next resistance.
www.tradingview.com
People sell on news. Here needs a healthy pullback, and markets continue its cycle. As a consistent and prudent traders, we should be Greedy when markets are fear.
It is easier to say than doing it.
Let's monitor the movement of the index and act accordingly and do not anticipate until we see confirmation from markets.
Again, sticktoyourplan trade according to time frame and set TP/SL.
Trading to make pocket money isn't that challenging and it can be boring and you can make it fun and zen with it.
Let's follow our own strategy and zen with 📙 and 🍵.
Happy Trading everyone!
Wishing everyone a good prosperous year of 2025 with many winning trades!
Zentradingstrategy

Almost there! Breaking through for BullPEPPERSTONE:HK50
HSI:HSI
Look at the 4H chart.
MACD - Golden Cross arching up this morning.
KDJ - Bullish zone but overbought zone.
BB - Ranging at upper BB channel and continue to arching up.
Cross-checked with broader tf chart - D chart.
KDJ is now at bullish zone but overbought.
MACD are still below zero level but seems arching and inching to break zero level to give confirmation of bullish.
Continue to monitor to wait for MACD Signal cross above zero line confirming BULLISH.
Can accumulate and swing trade for 4 wks-6 wks.
Look at the 1H chart.
MACD has confirmed its bullish.
KDJ has been moving through the bullish and bearish cycle.
Range Upper BB : 20120 - 20300
Lower BB : 19985 (support level) - 20119.
For day trade: Same strategy, sell at resistance; buy/TP at support.
Monitor the 1H,4H movement with confirmation using MACD & KDJ indicator.
Set your tf, have your entry and exit plan!
Support : 19980 ( next support level 19930)
Resistance : 20330 (if breaks then 20450)
Trading to make pocket money isn't that challenging and it can be boring and you can make it fun and zen with it.
Let's follow our own strategy and zen with 📙 and 🍵.
Reminder : to slowly To take action to accumulate Hong Kong and China stock/ETF/Index and wait for 12-24months or more to have an exponential capital gain. Check the Month Chart you will notice, is almost there already....
HKEX:2800 - create position at around 20.50 and add position if pullback to 19.30 (Both Fibo level)
HKEX:2823 HKEX:2801
February news is around the corner from local authority. Let's see if that's the case.
One of the positive news:-
www.scmp.com
Again, news are distraction. 😂
Please DYODD and take action to diversify your investment portfolio with China & HKG exposure.
Happy CNY everyone and happy trading!

retreat frm ytd 'short bullrun'; look at key support levelPEPPERSTONE:HK50
HSI:HSI
Look at the 4H chart.
MACD - Deadcross curving down
KDJ - Bearish zone.
BB - entering lower band.
Cross-checked with broader tf chart - D chart.
MA20 :19632
MA52 :19738 (MA52>MA20)
KDJ is now at bullish zone; overbought.
Both KDJ and MACD are still below zero. MACD seems to be forming a curve; it may go down if there is no strength to break above the zero line and turn bullish.
We can probably see a sideways movement until the distraction—news announced in February.
Continue to monitor to wait for MACD Signal cross above zero line confirming BULLISH.
Can accumulate and swing trade for 4 wks-6 wks.
Look at the 1H chart.
The pullback is delayed but inevitable.
At point of observed KDJ it's in red bearish zone.
MACD is at bullish area fast line is touching signal line forming a dead cross within Bullish zone.
For day trade: Same strategy, sell at resistance; buy/TP at support.
Monitor the 1H,4H movement with confirmation using MACD & KDJ indicator.
Set your tf, have your entry and exit plan!
Support : 19782 (next 19742, 19300 ; key support level 19545)
Resistance : 19900 (if breaks then 20030)
Sticktoyourplan follow your trading strategy.
Trading to make pocket money isn't that challenging. Although it can be boring, you can make it fun and zen with it.
Let's follow our own strategy and zen with 📙 and 🍵 to let the results realized.
Reminder : to slowly accumulate Hong Kong and China stock/ETF/Index and wait for 12-24months or more to have an exponential capital gain. Check the Month Chart you will notice, is almost there already....
HKEX:2800 HKEX:2823 HKEX:2801
Time frame is important! Prepared for the rollercoaster short-term rider for these two markets.
Time is our friend!
Trend is our friend too, do not go against it.
Happy Trading Everyone! ☺

HSI performance with the 47th president inaguration PEPPERSTONE:HK50
HSI:HSI
Hello everyone! CNY is around the corner, am about to off for celebration.
Hope who celebrate CNY enjoy and welcoming the new wood snake 🐍 coming.
Is gonna to be a challenging and fascinating year to both West and East.
The trade plan.
Look at the 4H chart.
Both MACD & KDJ are arcing again (MACD still within the bearish zone, below zero level)
MACD is at bullish zone but fast line curving down.
KDJ at overbought zone and curving down and turned into red zone indicate Bearish.
Cross-checked with broader tf chart - D chart.
KDJ is now at bullish zone but overbought.
Both KDJ and MACD are still below zero level. Bearish, monitor to wait for MACD Signal cross above zero line confirming BULLISH.
1H chart the Index had soared 440++pts; +2.27% for HK50 yesterday.
Pullback is inevitable today.
At point of observed KDJ it's in red bearish zone.
MACD is at bullish area fast line is touching signal line forming a dead cross within Bullish zone.
For day trade: Same strategy, sell at resistance; buy/TP at support.
Monitor the 1H,4H movement with confirmation using MACD & KDJ indicator.
Set your tf, have your entry and exit plan!
Support : 19895 (next 19778; key support level 19545)
Resistance : 20300 (if breaks then 20350)
Sticktoyourplan follow your trading strategy.
Trading to make pocket money isn't that challenging and it can be boring and you can make it fun and zen with it.
Let's follow our own strategy and zen with 📙 and 🍵 to let the results be realized.
It can be a winning trade or losing trade, it doesn't matter. We are aiming for long horizon; as we are not gambling or speculating.
The markets is always gonna be there.
Reminder
For the East : to slowly accumulate Hong Kong and China stock/ETF/Index (undervaluation) and wait for 12-24months or more to have an exponential capital gain. Check the Month Chart you will notice, is almost there already....
For the West : AI applications, Digital assets for sure but not all in one basket. Diversified.
Time frame is important! Prepared for the rollercoaster short-term rider for these two markets.
Time is our friend!
Happy Trading Everyone! ☺

is the index in booze again and in breakdance mode? PEPPERSTONE:HK50
HSI:HSI
Hello bello...everyone, may all your trade closed in profit!
As mentioned in yesterday post, the Index was in a bearish mode but be cautious.
Look at the 4H chart, do you see?
Both MACD & KDJ are arcing again (MACD still within the bearish zone, below zero level)
4H chart - Bearish (bullish reversal within bearish zone, temporary -this can be fake rebound 😂)
Cross-checked with broader tf chart - D chart.
KDJ is now at oversold area 20.
Both KDJ and MACD below zero level. Bearish.
1H chart
the Index seems has no mood and strength to move and need quite a long rest...
Mood change overnight, re-adjust and in the action.
MACD - reversal for bullish generating green histogram; although the signal within bearish zone. Hence, for day trade is bullish for the week it could be pullback.
KDJ completed the bearish mode and turned bullish; at the point of observation, it was overbought at KDJ ~75.
MACD arcing up Bullish, KDJ overbought zone - this signal divergence; so cautious of the potential correction. It's likely to pullback. Hence, trade cautiously.
For day trade: Same strategy, sell at resistance; buy/TP at support.
Monitor the 1H,4H movement with confirmation using MACD & KDJ indicator.
Set your tf, have your entry and exit plan!
Support : 18300; today broke the support level hopefully it stays above 19070 level. (if breaks then next 19300)
Resistance :19200-19300 (if breaks then 19450, then 19650)
Sticktoyourplan follow your trading strategy.
Trading to make pocket money isn't that challenging and it can be boring and you can make it fun and zen with it.
Let's follow our own strategy and zen with 📙 and 🍵 to let the results realized. It can be a winning trade or losing trade, it doesn't matter. We are aiming for long horizon; as we are not gambling or speculating.
Rememeber to allocate some of your gained pocket money for long term asset investment.
We should take contrarian strategy. Accumulate Hong Kong and China stock and wait for 12-24months or more to have an exponential capital gain.
Check the Month Chart you will notice, is almost there already....
PEPPERSTONE:HK50 HKEX:2800
Time frame is important! Prepared for the rollercoaster short-term rider for these two markets.
Got your trade plan ready for 2025, or are you still figuring out your moves?
Share your view OR hit the 🚀 , signal that you keen to explore.
Happy Trading Everyone! ☺

this week clearly more bearish than bullish but again cautious!PEPPERSTONE:HK50
HSI:HSI
Hello bello.....May everyone trade in the state of peaceful and calming mind.
Hong Kong Stocks Post Five-Day Rout
Hong Kong stocks ended lower on last Friday, extending the losing streak to a fifth session, as sentiment remained downbeat due to concerns over US-Sino trade tensions.
The Hang Seng Index retreated 0.92%, or 176.60 points, to end the week at 19,064.29.
Is the news helping? News is distraction. 😂
What's the magic numbers to look at for HSI for the near short-long term?
Well, we are now in the pullback correction area, worth to notice and recall that in fact in 2024 the index has actually bringing the full-year with almost 18% (17.67%) gain; closed at 20059.
Support: 18569, 18215 (from W Chart you can see this is the support level from May,Sept 2024). If this breakthrough then we will see the index at 17570 level.
Resistance: 18,930, 19,700 (well there are analyst forecasting that HSI has an upside of 15% targeting to 20,3000 by end of 2025)
b]4H chart - Bearish
Both MACD & KDJ are indicating Bearish mode.
MACD - remained at bearish zone, line still arcing. [ s]But crossing up. Good sign.
KDJ - remained in bullish green zone, indicating uptrend signal. Turned bearish.
Cross-checked with broader tf chart - D chart.
Bearish - at Oversold zone,below 80
Both KDJ and MACD below zero level. Bearish.
1H chart the Index seems has no mood and strength to move and need quite a long rest...
For day trade: Same strategy, sell at resistance; buy/TP at support.
Monitor the 1H,4H movement with confirmation using MACD & KDJ indicator.
Set your tf, have your entry and exit plan!
Support : 18215 (if breaks then next 19070)
Resistance :18650 (if breaks then 19450, then 19650)
MACD - closing to touch zero line trying to breakthrough but with the red histogram it looks likely dipping down.
KDJ - in bearish zone. It may be divergence signal that on the oversold area and could see a rebound.
Sticktoyourplan follow your trading strategy.
Trading to make pocket money isn't that challenging and it can be boring and you can make it fun and zen with it.
Let's follow our own strategy and zen with 📙 and 🍵 to let the results realized. It can be a winning trade or losing trade, it doesn't matter. We are aiming for long horizon; as we are not gambling or speculating.
Rememeber to allocate some of your gained pocket money for long term asset investment.
We should take contrarian strategy. Accumulate Hong Kong and China stock and wait for 12-24months or more to have an exponential capital gain.
Time frame is important! Prepared for the rollercoaster short-term rider for these two markets.
Got your trade plan ready for 2025, or are you still figuring out your moves?
Think of it like prepping for a wild night out—plan your entry, know your exits, and avoid getting caught in the wrong crowd (aka bad trades).
Happy Trading Everyone!

still figuring out the moves? PEPPERSTONE:HK50
HSI:HSI
Happy Friday everyone!
www.tradingview.com
The Hang Seng fell 39 points or 0.2% to end at 19,241 on Thursday after trading modestly higher in the morning, with eventual losses in financials and property.
Is the news helping? News is distraction. 😂
4H chart
Both MACD & KDJ are on the divergence.
MACD - remained at bearish zone, line still arcing. But crossing up. Good sign.
KDJ - remained in bullish green zone, indicating uptrend signal.
Cross-checked with broader tf chart - D chart. It's still at oversold zone ,below 80 for KDJ and MACD below zero level.
1H chart the Index is dancing within very narrow range for today.
Support : 19130 (if breaks then next 19070)
Resistance :19375 (if breaks then 19450, then 19650)
MACD - closing to touch zero line trying to breakthrough but with the red histogram it looks likely dipping down.
KDJ - in bearish zone. It may be divergence signal that on the oversold area and could see a rebound.
For day trade: Same strategy, sell at resistance (19371); buy/TP at support (19070 strong support level; then 18910). Monitor the 1H,4H movement with confirmation using MACD & KDJ indicator.
Set your tf, have your entry and exit plan!
Sticktoyourplan follow your trading strategy.
Trading to make pocket money isn't that challenging and it can be boring but you can make it fun and zen with it.
Let's follow our own strategy and zen with 📙 and 🍵 to let the results realized. It can be a winning trade or losing trade, it doesn't matter. We are aiming for long horizon; as we are not gambling or speculating.
Rememeber to allocate some of your gained pocket money for long term assets investment.
Is end of the full trading week for 2025.
Got your trade plan ready for 2025, or are you still figuring out your moves?
Think of it like prepping for a wild night out—plan your entry, know your exits, and avoid getting caught in the wrong crowd (aka bad trades).
Share your ideas and goals with fellow market party animals, hype each other up, and sharpen your skills with regular practice. Let’s make this trading year a VIP experience!
Happy Trading Everyone!

waltzing within the boxPEPPERSTONE:HK50
timing markets is virtually impossible
we don't have crystal ball🔮 and hence we don't predict or speculate.
let's dance with the index
From yesterday post, from the indicators we keep an eye to monitor as it may rebound...
so is this the rebound ?(yes maybe short-term).
A full reversal? again, we don't know! But, don't think so, always cross-check with broader tf - D Chart. It's still at bearish zone; oversold zone (continue to monitor....)
From the 4H chart
Both MACD & KDJ turned around giving reversal signs.
MACD - although still below zero level but we can see the lines are curving up.
KDJ - turned into bullish green zone, indicating uptrend signal.
The 1H chart - the Index moving within the box. You may use BB indicator to get the range too.The previous range red box 19000 - 19200.
Support : 19200 if breaks then next 18960)
Resistance :19440 (if breaks then 19647, then 19945).
For day trade: Same strategy, sell at resistance; buy/TP into support.
Monitor the 1H,4H movement with confirmation using MACD & KDJ indicator.
For swing trade : Set your tf, entry and exit plan.
For slightly mid-long term trade (more than 9months - 36months++) : You may plan and DCA the Index. You may take a long position on HSI Tracker Fund 2800. HKEX:2800
The index is currently in a discount zone, check the historical price; there are ample of room to reach its ATH @33500. The law of attraction; we know that whatever bottom eventually rebound, it's the matter of time.
DYODD. Plan your trade, do not listen to anyone including this post!
Profitable traders/investors take contrarian moves. It's challenging but worth spending some time to think:- Ultimately what we want to achieve from our action/trading...
Sticktoyourplan follow your trading strategy. Set your SL/TP.
Once set, you may zen with 📙 and 🍵 wait for the results.
Happy Trading Everyone!
dancing cha-cha within the range ; be cautiousPEPPERSTONE:HK50
HSI:HSI
Helloy bello everyone!
Seems like the party ain't ending soon, is dancing cha-cha for the past few 1H candles
From the 4H, it seems inching down.
as the MACD & KDJ both indicating bearish mode.
Cross-checked with broader tf chart - D chart. And it's at oversold zone; keep an eye as it may rebound.
The 1H chart - the Index grasping at the level between 19200-19500
Support : 19200 (yesterday texted 19224; if breaks then next 18960)
Resistance :19500 (if breaks then 19650).
For day trade: same strategy, sell at resistance (19370-19400); buy/TP at support (19250-19270).
Monitor the 1H,4H movement with confirmation using MACD & KDJ indicator.
For swing trade : Set your tf, have your entry and exit plan.
For slightly mid-long term trade (more than 9months - 36months++) : You may plan and DCA the Index. You may take a long position on HSI Tracker Fund 2800 HKEX:2800
The Index is currently in a discount zone as it's traded 30% above its historical all-time-lo (ATL);
Ignore the news and plan for your long term capital gain game plan, be patience and zen.
The law of attraction; we know that whatever bottom eventually rebounds, it's a matter of time.
DYODD. Plan your trade, do not listen to anyone. You can't make the money beyond your realm of capabilities.
Sticktoyourplan follow your trading strategy. Set your SL/TP.
Once all is set, let's zen with 📙 and 🍵 wait for the results.
Happy Trading Everyone!

Do you see it as a opportunity to scoop the dip?
PEPPERSTONE:HK50
Hello everyone, good day!
PEPPERSTONE:HK50 HKEX:2800
The 1H chart - the index had lost its strength and has plunged ~300pts from its morning open @19587.
Hi : 19868 (higher than 19876 @20250105 1H Hi)
Support : 19300 ( ati point of writing broke the level; next 19130, 18965) .
Monitor if is able to stay at this level.
Resistance :19600 (if breaks then 19700). Unlikely.
www.scmp.com
Do you see it as a opportunity?
For day trade: Same strategy, sell at resistance (19353); buy/TP into support. Monitor the 1H,4H movement with confirmation using MACD & KDJ indicator. Here taking Bearish position.
For swing trade : Set your tf, entry and exit plan.
For slightly mid-long term trade (more than 9months - 36months++) : you may plan and DCA the Index. You may take a long position on HSI Tracker Fund 2800. HKEX:2800
The HSI is currently in a discount zone as it's traded 30% above its historical all-time-lo (ATL); there is ample of room to reach its ATH @33500. The law of attraction; we know that whatever bottom eventually rebounds, it's a matter of time. DYODD. Plan your trade, do not listen to anyone including this post!
Sticktoyourplan follow your trading strategy. Set your SL/TP.
Once all is set, let's zen with 📙 and 🍵 wait for the results.
Happy Trading Everyone!

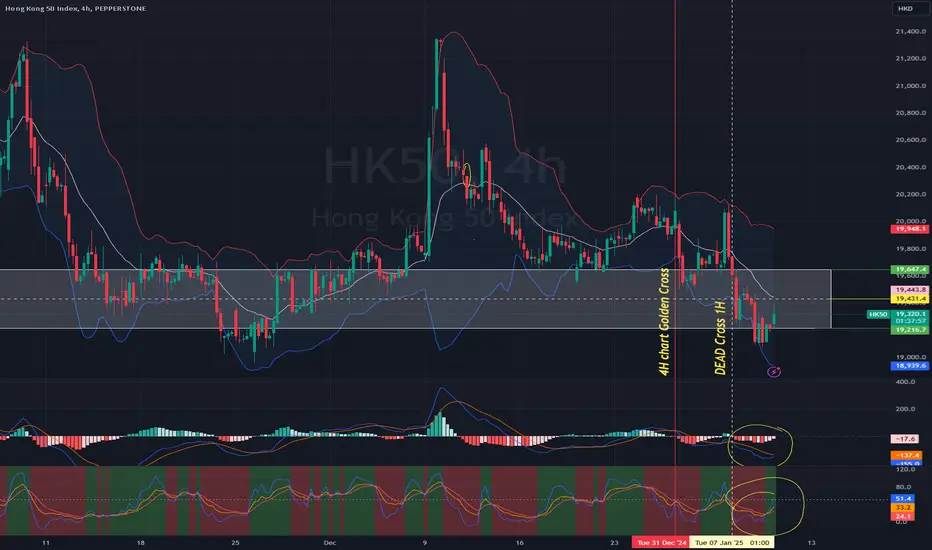
2025 NewYear Party with severe Hangover again!PEPPERSTONE:HK50
Happy New Year everyone!
1h Chart
From the chart we can see the 1h MACD forming Golden Cross on last 31/12/2024 0900; it was pumped to have a nice closure for 2024 and went for a heavy party.
This morning, as we can see the hangover hits quite severely! The index plunged more than 500bps this morning.
The MACD indicator now is forming Deadcross and in its bearish mode. The KDJ is also in its bearish zone.
Today the index could find support at 19453 and resistance at 19753.
D Chart
Well, we wish we had a crystal ball.
From the D chart, the MACD line crosses the Signal line forming a Deadcross. However, the Signal line is yet to cross below zero although the KDJ is already in its bearish zone.
Do not be swayed by the news, stick to your plan and set your TP/SL.
Do not anticipate and speculate how the markets move, we can only react with Buy,Hold or Sell.
Let's monitor the movement and practice your zentrading strategy.
Happy trading everyone!
Wishing you the best coming to you this 2025!
Let's continue 🧘♂️ Zen-ing with 📙 and 🍵.

at least a meal treat for the weekend!FX:HKG33
Hello everyone, from the D chart, the index seems dancing within the dancefloor.
From 1h chart
today trade plan : same old same old strategy sell into resistance and buy at support.
From the shorter tf we can notice probably end of the week and index seems giving meal treat.
🥩 🦃.
For the first hours from the MACD signal and KDJ it seems bullish.
Long for the first half; continue to monitor see if it breakthrough 19975/20000.
Happy trading everyone!
Stick to your plan, set your SL/TP. Let's zen with 📙 and 🍵 while waiting for the meal treat and show your gratitude and love the Index although sometimes it doesnt go according to our plan. 🥂

Do you see what I see? Uncle Roger quote: Haiya!FX:HKG33
Hello everyone!
Do you see what I see?
Haiya! not sure if the overnight fed news probably injected more booze; the Index seems continues to hangover and not gonna sober anytime soon.
4h chart
Price movement - Bearish
MACD Signal indicator : Bearish
D chart
no sign for bullish, the reversal seems not happening that soon.
To gain some pocket money, from chart we do not go against the trend.
Same old strategy - sell into resistance today.
Be cautious if the reversal happens this week, tomorrow is the end of the week.
As of writing, the index loss around 250++pips ; down around 1.45% this week.
See W chart:
Happy trading everyone and the Santa actually is there always, you can long/short for the 🎄 📦.
Let's be cautious to protect our capital unconditionally while monitoring the movement let's Zen with 📙 & 🍵!

the hangover hit quite long isn't it?FX:HKG33
Hello everyone! The index seems got some booster?
D chart shown that the
MACD Signal lines are both are closing the gap and touching the zero line.
Price : 19700 - 19730 is the support level
We do not know if this is gonna be bullish or bearish. How to cross-check and confirmed?
Let's deep dive into smaller tf:-
4h chart
On 9Dec2024 we can see the Golden Cross from MACD indicator. Infact the index did surged for that day but it did not last long. As you can see the Dead cross on 11Dec2024 as marked in chart for easy reference.
1h chart
as marked 12Dec2024; the MACD signal formed a Dead cross crossing down the zero line which confirmed it was in a bearish zone. This bearish mode has continue till date.
However, you can see the indicator starting contributing green histrogram and the MACD line is curving up and touching zero line, as mentioned we are hoping that there is attraction for volume to realize the reversal.
So we have to monitor closely and see if we can ride on the reversal.
Support level at ¬19700.
The Index will continue to test this support level.
BB : we can see the movement is slowly curving up, and hopefully this continue together checking and confirming with the MACD curving up trend.
Also to look at the KDJ, although is in bullish green zone but the indicator seems curving down.
Swing trade plan buy into support sell at resistance and set your SL/TP. Trade according to your tf ; set your entry/exit plan accordingly.
Support Level ; 19700, 19520, 19315(another key support level)
Resistance Level : 19900,20050-20250
Happy Trading Everyone!
Let's execute our zen strategy and zen with 📙 and 🍵.

not yet sober; continue with bearish sentiment.
Resistance level : 20070-20090
Support Level : 19670 - 19568
If breakdown thru 19303 the next bus stop will be 19080 i.e 🆘 level as you can see from 1h chart.
Tradeplan : buy into support and sell at resistance, set your SL/TP.
From today macro overview, most of the traders likely to short the index. To trade for 100-150pips profits for tomorrow and within this week for 200pps is feasible. Remember your SL and locked in profit.
tradingview.com/news/mtnewswires.com:20241216:G2446630:0-hong-kong-stocks-extend-slide-on-disappointing-chinese-economic-data-ganglong-china-property-slumps-10/
The Hang Seng Index fell 0.88%, or 175.75 points, to close at 19,795.49.
For D chart
We are hopeful to see the reversal; the MACD Signal is now breaking above zero level and
although the KDJ still in bearish zone.
Let's continue to monitor; while waiting for more positive news and hopefully Santa remember to drop by the index chimney to give it a boost we shall zen with 📙 and 🍵!
Happy Trading Everyone!

ZENT/USDT NEW INCREASE NEW ATHThere is a good possibility with time that ZENT can increase to NEW ATH.
This can take some time. -> The coin seems to have a new volume.

The booze seems quite strong; the hungover continue aft party!FX:HKG33
hello everyone TGIF!
Trade plan for today before end of the week.
It continues to dance btw range as shown in chart : 19800 - 20500 (1h Chart)
To trade using smaller range tf.
For the week it's still a small gain.
Shorted earlier hoping to take some profit for 🎄 weekend meals. ☺
Again to set your SL/TP level.
4H Chart
The 4h chart showing the index is still on the bearish zone.
Happy Trading and have a good weekend everyone!
while waiting toTP let's continue to zen with 📙 and 🍵!

Recovering from hangover?
FX:HKG33
Can you see what I see?
It is recovering from the party trying to keep its energy at 20300 level.
Today trade plan - Long! Again put your SL.
Happy Trading everyone!
While waiting to harvest the profit, continue to zen with 📙 and 🍵.
☺

Is The Reversal End? Will the rebound party last?FX:HKG33
Is the Index rebound strong? Based on the 1h chart, you know the answer.
What is the range to look out for?
10EMA crossing down 52EMA on 1h chart. Not good.
MACD signal break through zero line level indicate bearish mode. Histogram bearish color in deep red like the index. Required "blood/live" to boost.
From the Money Flow Profile : 20208.39 level shown the selling pressure with huge volume. You know where to get the indicator and how to read it.
KDJ Indicator, kind of confirming the bearish zone for the hour.
Consolidation area : 19750-20300(the index dance between the rangebound)
as mentioned in previous post reaccumulate at 19730-20300.
D Chart
Price 20165.88 closed below 52EMA - 20354.18 (Down 171.28; -0.84%)
For the Week, as of today - it is still gaining 391.15 +1.98% from Open : 19,774.73 on 9Dec24.
Let's continue to monitor and see if the authority fiscal policy benefit and boost the reversal.
Happy Trading!

Key Support Level! FX:HKG33
Hi everyone, did you managed to ride on yesterday the fireworks and joined the party?
If you are following the movement of HSI then probably you are in the game and able to catch the short term fireworks Bull :)
Yesterday the Index seems being injected with stimulant - based on HKG33 (surged 1,013.46; +5.13%)
Let's look together at the D,4h & 1h charts where they've had given us signal of the boost.
D Chart
4h Chart
1h Chart
- Price is moving downwards closing to the 52EMA (20137)
- MACD Signal with Deadcross and KDJ at bearish zone
However, as mentioned in previous post my personal POV, prefer the movement slow and steady forming a stable staircase; more sustainable.
As you can see, today the candles seems tired after the stimulant boost for the party.
Then, did you managed to short for the reversal for some pocket money? :-)
Trade Plan -
Day Trade : Swing Lo: 20290-20800 (Long at support and short at resistance depends on your own tf)
Swing Trade : 2 days - 5days : Swing Lo:21350 Swing Hi :18960
Re-accumulate at/below 19730-20300 level.
Please note that 19730 & 20300 are keys support/resistance level. Remeber to put your SL for traders.
Longterm Trade : With the recent China govt calls for proactive fiscal policy in 2025 (appropriately loose monetary policy), it's confident and confirmed that both China and Hong Kong markets will benefit and the reversal is for real. We can start to expose and accumulate more in both countries.
For HSI to break the range 22900-23275 and make new ATH would be very soon.
Happy Trading everyone!
Let's continue to monitor the Index movement and dont forget to follow your zen trading strategy.
Trading is a lifelong learning path , continue to practice and master the skills by reading 📙 and 🍵.
Reading helps to form a good habits for thinking and sometimes is a good method for distraction (not to keep looking at chart) once you have set your TP/SL following your strategy. :)

About to breakthrough!FX:HKG33
From previous post - D chart shown that the MACD SIgnal lines are both downtrend and breakthrough the zero line. Forming a short term bearish mode.
The Index corrected down to 18956 (last week low).
As you can see from the snapshot from W chart that week of 11Nov,
week of 18Nov: -246.64 (-1.27%)
week of 25Nov: +395.16 (+2.06%)
This week - 2 Dec : as of now -109.64 (-0.56%) if the Index able to hold at the support level of 19330 and break 19785, the Index then considers reversal.
the MACD Signal lines.
Trade Plan -
Day Trade : 19000-19700 (Long at support and short at resistance dependings on your tf
Swing Trade : 2 days - 3wks : Accumulate at 19000-19150 Discount level, Take partial profit at 19300, 19700.
Longterm Trade : The Index is now retracing. May accumulate & hold at 19340 (if you have been monitoring accumulating starting 16900.

Is it the time to Buy the Dip? FX:HKG33
As you can see from 1D chart - the MACD & Signal line both are on downtrends.
Be cautious if the MACD fast line break below the zero line.
From W chart, you can see the MACD & Signal lines are both staying zero line i.e bullish mode but on a weaker momentum ( the KDJ is on bearish zone and the MACD histogram with ligher green). Also the MACD line (blue line) seems forming a curving down movement.
The next Support level at 18186 (the sudden surge on the 26Sept2024 +1239.06;6.41% that day)
From 1h chart, at point of commenting it seem that the index is on Bearish mode, it might take a while to rebound to previous support level (the new resistance ) at 19500-19520.
You may not want to open bullish too early if it's not break through the level.
Shorterm
Bearish - it seems the index will continue to be downtrend based on 4h BB; but SL at 19834, you may set TP at 19146 (the next support level)
Peoples Sell on News
www.tradingview.com
##
From Reuters : China and Hong Kong stocks fell on Thursday after Beijing's latest measures to revive the struggling property sector failed to boost investors' mood.
##
Longterm
Let's continue to monitor the D chart with MACD & KDJ indicator if there is clearer signal to take position.
While waiting let's zen with 🍵 & 📙

Summary of the week and a swing long position & locked profit
FX:HKG33
Summary of the week for the index.
1h chart form a golden cross below zero line and happen that 4h chart had formed the same golden cross even though both are below zero line. I took a aggressive & several long position.
TP at 20735 level at time was looking at the index trying to close the week gap.
I did keep some position open hoping that the US trading time could continue to boost the index.
But it seems it loose its steam and 4h chart not strong for MACD & Signal line breakout zero line.
the Index closed at 20506.46 (still record a decline of 1.21% -250.70). Looking at the W chart it seems pulling back and let's continue to monitor if its prepare for the next climb.
You may note that the W chart the MACD is above zero line still consider bullish but with weak lighter green histo.
Jya. Let's zen during weekend with 🍵 & 📙
