NZDUSD → Consolidation within the correctionFX:NZDUSD is forming a local correction on the background of the uptrend. The dollar has been consolidating and strengthening for the last week, which generally creates pressure on the forex market
NZDUSD after a false break of the trend resistance, which also coincided with the stopping of the strong decline of the dollar, entered the correction phase. Locally, it is a downtrend, followed by consolidation, which in general forms a flag - a figure of continuation of the movement.
The chart reveals strong levels that can be paid attention to. The dollar may continue its growth due to the US policy, which generally has a negative impact on the market.
The price exit from the current consolidation may be accompanied by a strong impulse. Emphasis on 0.575 - 0.571.
Resistance levels: 0.57426, 0.57674
Support levels: 0.571, 0.5684
After stopping at 0.571, the price is not pulling back, but forming consolidation on the background of the local downtrend. Most likely a big player lures the crowd to get to the imbalance zone or trend support at their expense.
Regards R. Linda!
Zigzag

GOLD → Growing economic risks increase interest ↑FX:XAUUSD rallied aggressively due to high interest driven by rapidly rising economic risks, mainly related to Trump's tariffs. For selling, the risk is very high, with the stock and cryptocurrency market declines only adding to the interest in the metal
Markets are taking refuge in defensive assets amid WSJ reports of Trump's possible tariff hike of up to 20% for most US trading partners. This could trigger inflationary pressures and stagflation, weakening the dollar and bond yields, which supports the gold price.
This week all eyes are on Trump's speech on Wednesday, PMI, NonFarm Payrolls and Powell's speech
Technically, it is not worth selling now as it is high risk, and for buying we should wait for a correction to key support levels
Resistance levels: 3127
Support levels: 3103, 3091, 3085
We are not talking about any trend reversal now. It is worth waiting for a local correction or consolidation, the market will mark important levels, liquidity zones or imbalances against which you can build a trading strategy. Gold will continue to grow because of the strongly increasing risks.
Regards R. Linda!

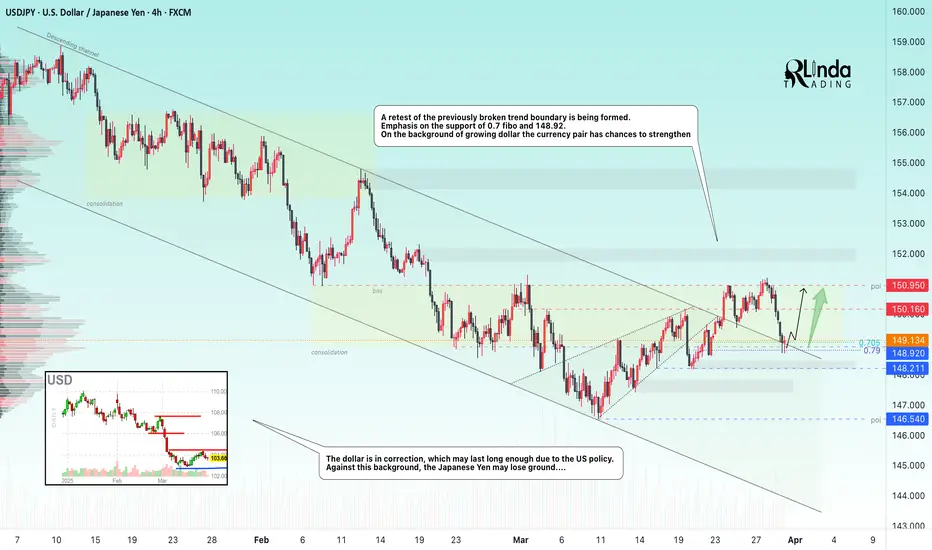
USDJPY → Key Level Retest. Attempt to change the trend FX:USDJPY in the correction phase is retesting the previously broken boundary of the downtrend. The market is trying to break the trend on the background of the dollar correction
The dollar is having a rather difficult life because of economic and geopolitical nuances regarding the USA, as well as high inflation. Against this background, the index may continue a deeper correction, as the rhetoric of interest rate cuts may be prolonged, which may put pressure on the markets.
The currency pair tried to overcome the downtrend resistance earlier and succeeded, but this is not enough for a trend change, it needs confirmation.
Support levels: 148.92, 148.21
Resistance levels: 150.16, 150.95
If the bulls hold the defense above 148.92 - 149.5, we have a good chance to catch a trend change. It will be the readiness to go to the resistance of 150.16 range, and the breakout of this level and price fixation above it will be the confirmation of the trend change
Regards R. Linda!
GOLD → Correction after a false breakout. A reversal?FX:XAUUSD is forming a false break of the channel resistance within the rally, we should wait for a correction, but not for a trend reversal. Let's see what we can expect from the price in the short and medium term.
Gold is reacting to market turmoil over Trump's tariff plans. Investors are looking for protection ahead of the possible imposition of new duties from April 2, boosting demand for the metal
Fears of a trade war and a slowing global economy are supporting gold despite positive US GDP data. PCE data and tariff updates will be key catalysts for further movement. Higher inflation could dampen the rally, while weak data will reinforce bets on a Fed rate cut, helping gold to rally further.
The energy to continue the move is gone, so I am waiting for a correction to the imbalance zone or to 0.7 Fibo to accumulate potential. The price may consolidate in the zone of 3050 - 3075 before it continues its growth
Resistance levels: 3075, 3085, 3095
Support levels: 3059, 3055
The correction after a strong rally can be quite deep. The imbalance zone 3066 - 3063 and liquidity zone 3057 play an important role. False breakdown of support may resume growth.
Regards R. Linda!

BITCOIN → Break of the bullish structure. Moving to 78-68KBINANCE:BTCUSD has been slowly recovering for the last two weeks, but failed to overcome the resistance. The bears held the trend. The price is breaking the local bullish structure and preparing for a strong fall.
Bitcoin's fundamental background is weak, expectations were not met by the crypto summits, nor by any major announcements or hints of a crypto reserve. The crypto community still didn't get what they expected from Trump. The strong drop was triggered by the SP500 index falling, driven by rising inflation, reduced consumer pressure and new trade tariffs. These factors have contributed to increased uncertainty in the markets, prompting investors to move to safer assets such as gold and government bonds
Technically, the price has been in consolidation (correction channel) for two weeks and after breaking the support of the figure, the price entered the realization phase within the global downtrend.
Resistance levels: 85300, 86350, 89400
Support levels: 83600, 81270, 79980, 78100
Emphasis on the support at 83600. The price fixing under this zone may provoke further fall to 80-78K. But I do not exclude the fact that a small correction to the zone of interest is possible (to capture liquidity) before a further fall to the previously identified key zones of interest.
Regards R. Linda!

MEWUSDT → False breakout of resistance after distributionBINANCE:MEWUSDT.P in the distribution phase is testing a strong resistance and liquidity zone against which it makes a false breakout.
Regarding the current situation, we should pay attention to several key levels - support and upper resistance. A retest of 0.00300 - 0.00312 is possible, the target of which could be another liquidity zone, before MEW continues its fall according to the current local and global trend, which have a common direction on the background of weak bitcoin and weak cryptocurrency market.
Resistance levels: 0.002793, 0.003, 0.00312
Support levels: 0.002696
The key support area plays the role of 0.002696, which are trying to contain the market. Below this line is a free zone and there are no levels that can prevent the movement. Thus, the breakdown and consolidation of the price under 0.026969 can provoke a strong impulse towards the zones of interest 0.00222, 0.002
Regards R. Linda!

LAYERUSDT → Far retest of key resistance at 1.400BINANCE:LAYERUSDT.P is forming a realization within the uptrend. The coin is stronger than the market, but the initial reaction to the strong resistance at 1.400 may be in the form of a false breakout and a pullback to 1.275 or 0.5 fibo
Since the opening of the session, LAYERUSDT has passed the daily ATR, but after reaching the resistance, the coin may not have the potential to continue rising. Liquidity above the 1.400 level may hold this area and prevent the coin from breaking through this zone the first time around.
Bitcoin is testing trend resistance at this time and could likely form a rebound or a continuation of the decline, which could affect altcoins accordingly!
Resistance levels: 1.400
Support levels: 1.2932, 1.2747, 0.5 fibo
BUT ! Everything depends on the price reaction at 1.400. A sharp and distributive approach with 90% probability will end in a false breakout and correction to the mentioned targets.
But, if LAYER starts to slow down and consolidate in front of the level, an attempt of breakout and struggle above 1.400 is possible and further movement will depend on it.
Regards R. Linda!

GOLD → Consolidation forms a trigger. Rally?FX:XAUUSD continues to rise amid weakening dollar demand due to Trump's imposition of new tariffs. GDP and Initial Jobless Claims ahead
Gold is further supported by renewed concerns about a slowdown in the US economy due to trade duties. However, growth beyond ATH remains questionable due to geopolitical nuances.
The market focus shifts to macroeconomic data: the final US GDP for the fourth quarter and jobless claims will be released today. Also the attention will be drawn to the speeches of the Fed representatives, who earlier made it clear that they are in no hurry to cut rates due to inflation risks caused by Trump's tariff policy
Resistance levels: 3038, 3046, 3056
Support levels: 3033, 3025
The strong resistance is 3038. Breakdown and price consolidation above this level will provoke continuation of growth (there is a chance of ATH retest). But, since there is news ahead, gold may test the zone of interest and liquidity 3030-3025 before further growth.
Regards R. Linda!

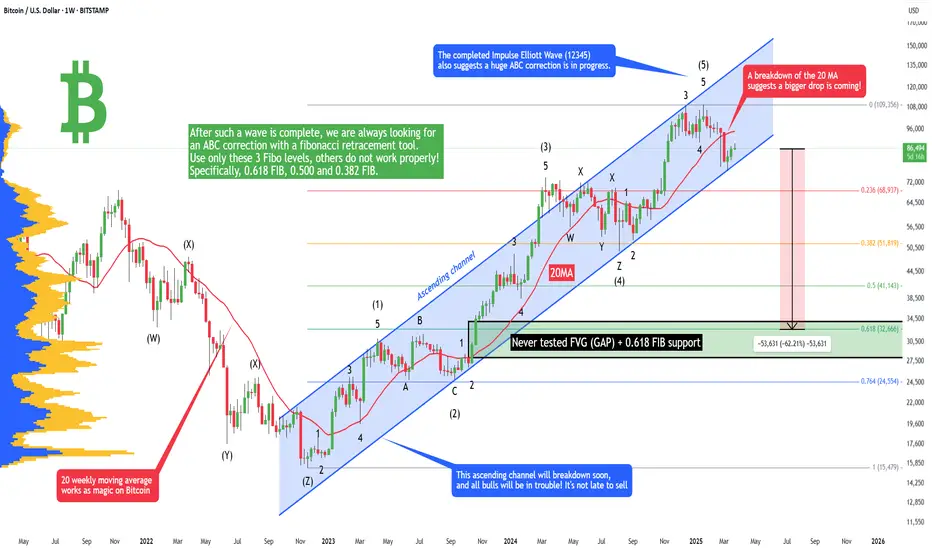
Bitcoin - Why is everyone wrong + Magic Moving AverageWe have so many warning signs that Bitcoin is going to crash significantly in 2025/2026. One of them is this magic 20-weekly moving average. As we can see, the price always respects this dynamic level, and if the price falls below it, it triggers a sell signal. On the other side, if the price rises above it, it triggers a buy signal. The price is currently below it, so this is a bearish signal.
The next bad signal is this Elliott Impulse wave. What we can see here is a perfect textbook impulse wave that has been completed. If you are an Elliott Wave trader, you already see that this is a big problem. After such a wave is complete, we are always looking for an ABC correction with a fibonacci retracement tool. Use only these 3 Fibo levels, others do not work properly! Specifically, 0.618 FIB, 0.500 and 0.382 FIB. Bitcoin loves the 0.618 FIB, so there is a pretty huge chance of going down to 32k. But expect a very strong bounce from the 0.382 FIB as well, which is at 52k. Set up your buy orders here, and thank me later!
What we can also see on the chart is an unfilled Fair Value Gap (FVG) between 34k and 28k. Often the price loves to come back and test these important price actions. This is a great buying confluence with the 0.618 FIB because the FVG is inside this Fibo level.
The last thing I want to talk about is this huge blue ascending channel on the weekly chart. This is a representation of this whole uptrend (bull market). You may say that Bitcoin is bullish until this channel holds, yeah, but what we do here is we predict future price action and give you technical analysis. I am giving you this information in advance so you can prepare for the future!
Write a comment with your altcoin + hit the like button, and I will make an analysis for you in response. Trading is not hard if you have a good coach! This is not a trade setup, as there is no stop-loss or profit target. I share my trades privately. Thank you, and I wish you successful trades!
GOLD → Price returns to the channel to form a bullish structureFX:XAUUSD is completing a correction, breaking channel resistance and consolidating above the downtrend line. Traders are waiting for economic data and tariff war actions
Trump confirmed plans to impose retaliatory tariffs on April 2, limiting exemptions. The new duties have raised fears for the U.S. economy, which has weakened the dollar and boosted demand for gold.Markets are also keeping an eye on talks between the U.S., Ukraine and Russia.Focus is also on US durable goods orders data - a strong reading could cool expectations of a Fed rate cut, limiting gold's gains
Resistance levels: 3033, 3045, 3056
Support levels: 3013, 3004
Gold may test the support zone before rising further. The focus is on the current consolidation 3033 - 3013. A key resistance is formed ahead, a breakdown of this zone may provoke a continuation of growth to 3045 - 3056.
Regards R. Linda!

GBPUSD → Correction to the liquidity zone. Waiting for a FBFX:GBPUSD gets a negative CPI report in the early session and tests key support, but failing to reach the liquidity area a rebound is formed. The pair is in consolidation...
The CPI report provoked a small liquidation in the market, within the framework of which the price tested one of the key supports at 1.2886, but the price did not enter the liquidity area, i.e. technically the chances to return to this area are quite high.
A correction to the imbalance zone is being formed, from which the decline may continue. In the short term I am interested in 1.2868, which can still hold the market and form a bullish impulse.
Resistance levels: 1.2926
Support levels: 1.2886, 1.2868, 1.2811
False break of the global range support at 1.2868 may trigger a rebound to 1.2926. I do not exclude a deeper correction to the support from D1, for example to 1.2811 from which, against the background of the bull market, we can wait for an upward correction.
Regards R. Linda!

IPUSDT → Exit from the triangle may trigger a distribution ofBINANCE:IPUSDT.P is forming positive preconditions for possible growth. Bitcoin slightly revitalized the market after positive news related to SEC and XRP (the crypto community did not miss this fact)
The IP coin was in consolidation for a long time - a symmetrical triangle. Rising lows, consolidation, breakout of triangle resistance give positive signs of readiness for distribution (realization of consolidation). Ahead is the key resistance at 5.6297 separating the market from the free zone
Resistance levels: 5.6297, 6.631
Support levels: 5.116, 4.783
Price has been sticking to triangle resistance for the past few days and is gaining potential for breakout and realization. Numerous intraday retests of the area indicate the market's interest to break beyond this zone. A breakout of 5.6297 and price consolidation above the triangle will be a good signal of readiness to go up.
Regards R. Linda!

GOLD → Tense fundamental environment and retest of 3025FX:XAUUSD is forming a correction within the descending channel. The situation is becoming complex and confusing. The focus is on the channel resistance and on the support at 3004.9. Further price movement depends on the fundamental data...
The problem is the uncertainty around the US tariff policy and the outcome of talks between Russia and the US on ceasefire in Ukraine.
The market is focused on US consumer confidence data and comments from Fed officials. The rise in the dollar, supported by Bostic's hawkish statements and strong PMIs, is pressuring gold, but the lack of clarity on tariffs and geopolitical tensions are limiting its further decline
Technically, the situation is simple in that it all depends on the resistance of the current channel. A break and consolidation above 3025 will trigger growth. A false break of the channel resistance will provoke a continuation of the decline both to 3004 and to 2980.
Resistance levels: 3024.6, 3038, 3056
Support levels: 3004.9, 2987, 2981
Based on the difficult fundamental environment, which is far from any positive decisions, the tensions in the Middle East, and the tariff war, I can conclude that gold will try to strengthen once again, as we have technical support: a strong bullish trend, a strong 3004 level, and a cascade of locally rising lows.
A failed breakdown will be false and in this case, a price consolidation under 3017 will trigger a fall to 3004.
Regards R. Linda!

EURUSD → Price is in consolidation. Emphasis on false breakdownFX:EURUSD is forming a correction within the consolidation that was formed on the uptrend. The reason for the consolidation is the halt in the movement of the dollar index...
The dollar is forming a counter-trend correction due to political and econmoic data, but the general background is bearish. But, the fall of the dollar, to which the index may soon return, may strengthen the growth of the currency pair. EURUSD consolidation within the uptrend (against the background of the dollar index correction). The zone of interest is the support at 1.078 and the imbalance area
Resistance levels: 1.078, 1.074
Support levels: 1.0936.1.1009
The price has not tested the support and is forming a correction to the imbalance zone 1.087 - 1.09 from which the price may return to the downward movement to 1.078. The emphasis is on the range support from which we should wait for a false breakdown before further growth.
Regards R. Linda!

GOLD → Long squeeze (false break of uptrend support) FX:XAUUSD within the liquidation the price is testing the key support at 3004.9 and forms a false break of support. The trend is generally bullish as the geopolitical situation remains tense and carries high risks.
Friday saw a liquidation phase relative to the consolidation at 3024-3045. Reason: the White House is expected to revise tariff policy, easing measures against key trading partners. Negotiations over the conflict in eastern Europe, where the U.S. is a key link, also support the positive sentiment. On Monday, market attention will focus on Russia-US talks, as well as preliminary PMI data that could affect the global economic outlook.
The focus is on the current consolidation and the 3024 level. If the bulls hold their defenses above this level, gold will continue to strengthen.
Resistance levels: 3045 - 3056
Support levels: 3024, 3004
The growth within the bullish trend may continue. The price is forming a consolidation between trend support and resistance at 3024. The emphasis is on 3024, if the bulls hold the defense over this zone, gold may head for a retest of the high (the initial reaction to ATH may trigger a pullback down)
Regards R. Linda!

Bitcoin - This bear flag will send BTC to 72,000! (sell now)The whole crypto market and Bitcoin are crashing, and it looks like 2025 will be a very red year! From a bitcoin cycle's perspective, bitcoin has entered a bear market. Let's look at the latest technical analysis on the 6H chart. Bitcoin hit a new all-time high on January 20, exactly the same day as Trump's first day in office. Thereafter, Bitcoin has been crashing.
Currently, the price prints a bearish flag on the 1H chart and a descending channel on the 6H chart. As long as Bitcoin is inside this descending channel, we have to stay bearish and trade with the trend until the end. This bear flag is also a problem because you would rather not see such patterns in a bull market in general. My next target is 72k, from here we could expect a bounce. Why 72k? Because it's the Fibonacci retracement of the previous major wave from 49k to 110k.
Write a comment with your altcoin + hit the like button, and I will make an analysis for you in response. Trading is not hard if you have a good coach! This is not a trade setup, as there is no stop-loss or profit target. I share my trades privately. Thank you, and I wish you successful trades!

BITCOIN → Flag (consolidation) before falling to 78-73KBINANCE:BTCUSD is consolidating after a short-squeeze relative to 85-87K. A bearish set-up is being formed, the break of which may strengthen further decline to the key target of 73K
A symmetrical triangle is forming within the downtrend on D1, a breakdown of this structure may strengthen the decline. Locally, within the channel a flag - bearish figure is formed (on the local TF false uptrend, the crowd enters to buy from the support or at the break of local resistance, at accumulation of the necessary potential the big player removes the limit order and releases the price, which is dispersed by liquidation of traders), regarding 85K-86.6K the liquidity capture is formed and the price returns to the selling zone. Consolidation below 85K may trigger a breakdown of the figure support and further fall to 80K-78K
Fundamentally: the market sells off any positive news very quickly (negative background is created):
crypto summits, (Trump said nothing new at the second summit)
positive resolutions of problems (for example between SEC and XRP, or removal of restrictions from local exchanges)
crypto reserve
The only nuance, bitcoin's dominance index is still high despite the price drop...
Resistance levels: 85150, 866700, 89400
Support levels: 82K, 80K, 78200
There are no positive signs for growth. The zone where we can consider a trend reversal ( if something supernatural happens ) is 89-91K, but it is very far away.
But now I would consider a breakdown of the flag, or 83.5 - 82.5 and price consolidation below this zone with the purpose of further fall to the local important level 78173. Then another consolidation or correction is possible before a further fall to 73.5K
Regards R. Linda!

EURUSD | 4H | WAIT BREAKOUTHey there, Traders,
I’ve put together an analysis for EUR/USD. Right now, I’m watching it like a hunter, waiting for a breakout. As soon as it happens, I’ll drop updates right here under this analysis.
Big thanks to everyone who supports me with likes—you guys are awesome!
God bless you all

GOLD → Consolidation (correction) before growth to $3100FX:XAUUSD is going into consolidation after strong growth on the back of dollar correction. The metal may test deeper support areas before attempting a new high
Gold is correcting, but remains in an uptrend
The decline in quotations may be seen as a buying opportunity, given the economic uncertainty due to Trump's tariffs and expectations of Fed rate cuts.
The Fed reiterated its forecast of two rate cuts in 2025 despite Powell's cautious comments. Gold is further supported by rising inflation risks and geopolitical tensions in the Middle East.
Resistance levels: 3045, 3057
Support levels: 3024, trending, 3004
Reaction to support is weakening, even amid the uptrend. Gold may stay in this consolidation until the middle of next week, or it may try to break out of the consolidation to retest deeper support zones, such as the rising trend line or the 3004 imbalance zone, from which the growth may resume.
Regards R. Linda!

EURJPY → False breakout of key resistance ...FX:EURJPY is forming a false breakdown of resistance and draws us a reversal pattern against the upper boundary of the descending price channel, as well as the pressure on the market creates the correction of the dollar...
On the daily chart the structure is bearish. After the false breakout of the global resistance a correction is formed, within which the price can test the imbalance zone or the previously broken resistance and continue its fall after the liquidity capture. The global trend is neutral and in this case it is worth considering local support levels as targets
Resistance levels: channel boundary, 162.3, 163.0
Support levels: 160.84, 158.9
A retest of the channel resistance or the area of 162.4 - 163 is possible. But any return of the price under the resistance of the descending channel and consolidation of the price in the selling zone may provoke further decline
Regards R. Linda!

GOLD → Fading out before the news. Possible long-squeezeFX:XAUUSD continues its bullish trend, but locally, the movement is in a very narrow channel (wedge). To form a potential for further movement, the price may form a long-squeeze before or at the time of news...
Fundamentally, gold remains a bullish asset due to the Fed's rate cut forecasts and economic risks associated with Trump's tariff policy. Gold hit a new high on Wednesday after the Fed reiterated plans to cut rates twice this year, raised its inflation forecast and worsened growth and employment estimates.The price is further supported by escalating geopolitical tensions in the Middle East, with Israel announcing the resumption of ground operations in Gaza.
Gold is forming a bull market. Before further growth (before the news) the price may enter the liquidity zone (fvg, 3028, 3024), after which it will continue to grow. Dollar enters local correction before the news, which creates pressure on gold
Resistance levels: 3046, 3051, 3056
Support levels: 3038, 3030, 3024
Price is forming a retest of the wedge support, which increases the chances of a breakdown. If the support fails to hold, the price may go down to the above support before rising further.
But! If gold bounces from 3038 and consolidates above 3044, the growth will continue without a deep pullback
Regards R. Linda!

Bitcoin - This indicator is always right! Crash to 40k in 2026.What we can see on the chart is Bitcoin cycles. We can statistically predict Bitcoin moves with this simple chart, because it's always right and never wrong. What can we say with certainty?
Statistically:
Bitcoin's bull markets last for 742 to 1065 days
Bitcoin's bear markets last for 364 to 413 days
Correction is every time weaker, but still huge
The recent uptrend on Bitcoin started in December 2022 and ended in January 2025 (791 days). We know that statistically bull markets last for 742 to 1065 days, so this indicator tells us that the bull market ended! This indicator was never wrong, so do your own research. It's always like this. Moon boys calling for 300k, 500k, or 1M in 2025 do not follow my TradingView profile because otherwise they would know this strong fundamental fact. The market cap of Bitcoin is already too big, so forget about 500K or 1M in the short term because the market cap would be higher than gold. Gold is the number 1 asset in the world.
Statistically, Bitcoin crashes every 4 years by 86% to 77%. The market cap is getting bigger as institutions step in, so this time I expect a weaker crash (around 65%). Still, it's a huge crash, and many investors will sell at a loss as usual. Knowledge of the Bitcoin cycles will save you a lot of money.
Bitcoin halving is coded to occur once every 210,000 blocks, or roughly every four years, and will continue in this fashion until the final supply of 21 million BTC is reached. It is assumed that the last BTC will be mined in 2140. After that, transaction fees are supposed to be the only source of block rewards for miners.
Write a comment with your altcoin, and I will make an analysis for you in response. Also, please hit boost and follow for more ideas. Trading is not hard if you have a good coach! This is not a trade setup, as there is no stop-loss or profit target. I share my trades privately. Thank you, and I wish you successful trades!

GOLD → Consolidation ahead of Fed rate meeting...FX:XAUUSD goes into consolidation 3038 - 3024 before the news - Fed rate meeting. The situation is generally predictable, but gold is reacting to rising geopolitical risks.
Gold is stabilizing before the Fed decision , markets are waiting for the data. The regulator is expected to keep rates, but Powell's forecasts will determine further dynamics.
“Hawkish” tone of the Fed may lead to the strengthening of the dollar and gold correction.
“Dovish” signals about economic risks will support the growth of metal prices.
Geopolitical tensions and Trump's tariffs continue to have an impact.The market is preparing for high volatility on the background of the Fed's decision and events in the world
Resistance levels: 2038, 2045
Support levels: 3024, 3015, 3004.9
Several scenarios can be considered for trading:
Breakdown of resistance 3038 - 3045, consolidation of the price above the level with subsequent growth to 3050 - 3060.
Or wait for the reaction to the news and with a possible breakdown of support to look for strong levels to trade a false breakdown, for example 3024, 3015, 3005.
Regards R. Linda!
