ZIL - Look out Tokyo, Here Comes GodZilliqaNow HERE is a textbook example of a Cup and Handle that's about to end. I mean if you want to learn some basic trading, here it is.
Cup and handle is a formation that's represented by a U shaped recovery or the cup, followed by a consolidation period representing the handle.
Then we go up
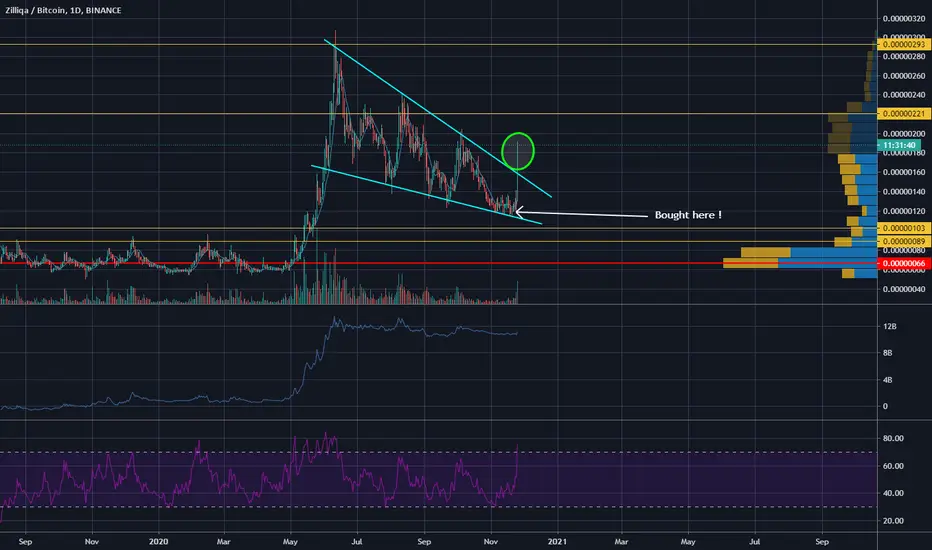
We've been in a historic accumulation area for weeks now.
Volume has absolutely tanked.
Actually every indicator on this chart points to a breakout. Easy catch.
This isn't financial advice. 🤙
Zil

HEADS UP !! Ziliqa breaking out !!Very powerful break out today !!
Happy I loaded the truck (+100% of my position) at the right moment !!
✳️Zilliqa/USDT (22/11) View + Trading Plan #ZIL $ZILZIL has just got out of the downtrend and is heading towards the 0.025-0.026$ zone, and it needs to confirm the uptrend by conquering this zone.
The 0.02$ zone is now reliable support, which can push up ZIL easily
📈BUY- LONG
-Buy: 0.02-0.021$, SL if B
-Buy more: 0.025-0.026$ if A
📉SELL-SHORT
-Sell: 0.025-0.026$, SL if A
-Sell: 0.034-0.035$, SL if A
♻️BACK-UP
-Sell close to 0.02-0.021$ if B, SL if A
-Buy: 0.016-0.017$, SL if B
-Sell close to 0.016-0.017$ if B, SL if A
-Buy: 0.012-0.013$, SL if B
❓Details
Condition A : "If 1D candle closes ABOVE this zone"
Condition B : "If 1D candle closes BELOW this zone"

ZIL / BTC add to your watchlistZIL / BTC
🌟 TECHINCAL ANALYSIS🌟
The coin was in Long downtrend on gaint falling wedge For More than 5 months
Expected big move soon ....
Market makers start to pump alot of coins
We can see big green candel today on ZIL/BTC chart ...price got rejected exactly at trendline
But not a buy signal yet .. need to breakout first / retest before entery
And some others bullish signs on small time frames
So keep it in your watchlist
Good luck and happy trading 🌹


ZILUSDT_DailyPrice:0.022 USDT
Entry LVL: 0.019-0.021 USDT
TP_LVL I: 0.027-0.029 USDT
SL: 0.018 USDT
Expected Return: 35 %
Reward/Risk: 3.49


ZIL Zilliqa potential breakoutZIL has a chance to make another leg up, after a long consolidation period. approaching the .786 line, ZIL has already confirmed a buy when crossing the 8ema with a 8/21 cross on the daily Time frame - November 6th. forming a very large inverse head and shoulders, a bullish signal has flashed once again. A break past the .786 with close and hold confirmation could lead to some very nice gains. 60% gains to $.035 are possible with the correction conditions being met. thanks for looking!

ZEC/USD Shows Clear Trend Behavior - Explanation How To TradeAll information about this ZEC/USD long trade can be found on the chart. I tried to make it as self-explanatory as possible. Should you have any questions, feel free to drop a comment or send me a personal message.

ZILUSDT - Potential buy entry 🔼ZILUSDT is printing an ascending triangle pattern at the mid region of the major descending channel.
Buy entry ⬆️ - breakout above the ascending triangle resistance.
Target - major descending channel resistance.

ZIL| Scalp Trade Short SetupHello Dear Traders,
on 4hr basis we have zil short setup.
entry exits are in chart above
this trade is valid for 2 days

ZIL/USDT 4 Hour ChartZil is coming down a bit further with before we should see a trend reversal. This particular pattern resembles a "Scythe" and is one of my patterns I created. Targets are laid out for the movement and the slight pullback levels. We can also see what appears to be a bull flag formation that is almost complete on the RSI. If you like the idea hit me with a like and if you disagree share why you do and follow for more updates
Cheers

Updated: ZIL still bearish. Corrective wave C underway.Bearish market sentiments not helped by increasing fresh wave of Covid19 infections, lockdowns across the globe, and lack of stimulus.


TWO KEY POINTS IM LOOKING ATClear close and consolidation above orange box, and I'll be a buyer.
If not, I will be looking to buy at the blue box, around 100 sats.


ZIL/USDT 1h (Binance Fut.) Parallel channel breakout & pullback#Zilliqa just broke-out bullish and volume increased a lot, time to look up now!
Current Price= 0.01889
Buy Entry= 0.01874 - 0.01850
Take Profit= 0.01916 | 0.01962 | 0.02024
Stop Loss= 0.01808
Risk/Reward= 1:1 | 1:1.85 | 1:3
Expected Profit= +11.60% | +21.48% | +34.80%
Possible Loss= -11.60%
Fib. Retracement= 0.5 | 0.618 | 0.786
Margin Leverage= 4x
Estimated Gain-time= 120h


Short idea - ZIL/BTCIt seems to be a good selling opportunity on ZIL / BTC.
This pair has been moving in a downward channel for more than three months.
The price is close to the upper channel's frontier, plus there is a clear horizontal resistance.
The downward trend reserve is about 20 per cent, to the middle of the descending channel.
Good risk/reward ratio.
You should wait for ATS confirmation at least on the four-hour timeframe to enter a trade.

ZILUSDT- BUY FOLLOW UPTREND & TAKE GOOD PROFITENTRY: 20xx
TAGET 1: 23xx
TAGET 2: 27xx
STOP LOSS: Break out of trend.
.......................................
GOOD LUCK!!!
