LONG - ZIL - Trading OpportunityBullish divergence on the daily chart, most likely this will be jumping back to the 90 sats mark
Entry: 0.00000070
Target 1: 0.00000078
Target 2: 0.00000084
Target 3: 0.00000091
SL: 0.00000065
CryptoCue is not providing investment advice and is not taking subscribers’ personal circumstances into consideration when discussing investments. Investment involves a high degree of risk and should be considered only by persons who can afford to sustain a loss of their entire position.
CryptoCue is not registered, licensed or authorized to provide investment advice and is simply providing an opinion, which is given without any liability or reliance whatsoever. The information contained here is not an offer or solicitation or recommendation or advice to buy, hold, or sell any security. CryptoCue makes no representation as to the completeness, accuracy or timeliness of the material provided and all information and opinions provided by CryptoCue are subject to change without notice and provided on a non-reliance basis and without acceptance of any liability or responsibility whatsoever or howsoever arising. You hereby irrevocably and unconditionally waive, release and discharge: (a) any and all accrued rights and/or benefits you may have against CryptoCue in respect of any opinion expressed or information conveyed by CryptoCue at any time; (b) any and all Claims you may have against CryptoCue arising out of any opinion expressed or information conveyed by CryptoCue at any time; (c) CryptoCue from all and any claims (whether actual or contingent and whether as an employee, office holder or in any other capacity whatsoever) including, without limitation, Claims you may have against CryptoCue arising out of any opinion expressed or information conveyed by CryptoCue at any time. ("Claims" shall include any action, proceeding, claim, demand, judgment or judgment sum of whatsoever nature or howsoever arising.) You hereby agree to indemnify and hold harmless CryptoCue in respect of any and all Losses paid, discharged, sustained or incurred by CryptoCue in the event of bringing any Claim against CryptoCue. (“Losses” shall include any and all liabilities, costs, expenses, damages, fines, impositions or losses (including but not limited to any direct, indirect or consequential losses, loss of profit, loss of earnings , loss of reputation and all interest, penalties and legal costs (calculated on a full indemnity basis) and all other reasonable professional costs and expenses and any associated value-added tax) of whatsoever nature and/or judgement sums (including interest thereon).)
Zil

Zilliqa Is On the Move | Easy 120%+ Coming SoonWe are quite familiar with this altcoin project/trading pair, Zilliqa (ZILBTC), we have been looking at it since it became available on the exchanges and it has been a great money maker for us.
Zilliqa Chart Signals
A new higher high was hit recently and ZILBTC started to retrace. We know that the ALTSBTC pairs are growing and that they will continue to grow now for years to come. So now that the support has been hit for ZILBTC, it can very easily move higher.
We can see bull volume going up, while bear volume is decreasing.
The RSI looks good on at 47 on this chart. This can be considered strong here.
Zilliqa's Path
If support breaks (0.00000066), ZILBTC can move lower and test 50-60 satoshis (red arrow).
If EMA10 (0.00000073) can be broken with good strength and volume, then Zilliqa can start to grow a lot and fast.
All the details are clearly shown in the chart above.
Feel free to leave a comment if you have any questions.
Here you can see our previous chart for Zilliqa (ZILBTC)
Thanks a lot for reading and for your continued support.
Namaste.

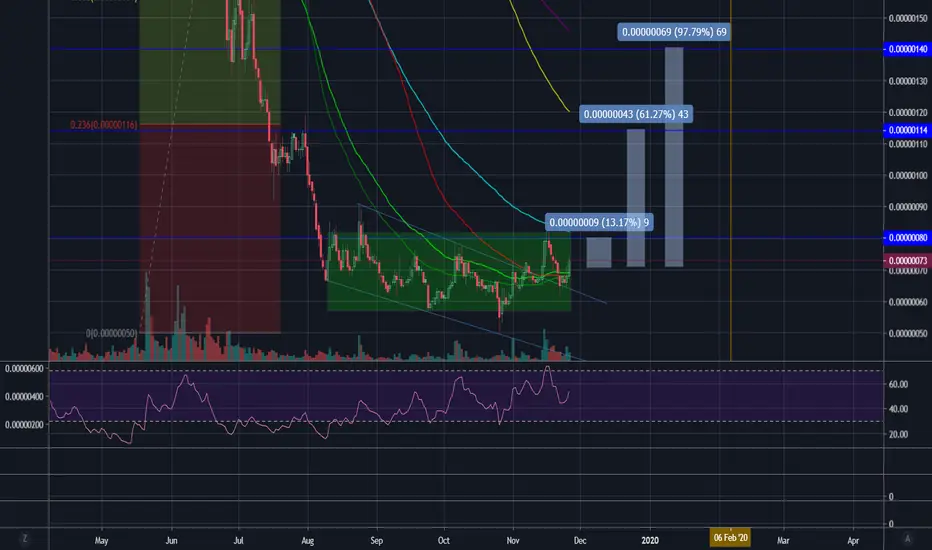
BOTTOM ON ZILLIQABINANCE:ZILBTC is building a potential rectangular bottom.
in the spirit of stratis i feel i should just put out charts on my watchlist with about same pattern
Accumulation zone 58sats -90sat
Breakout at 90 sat
Target at 119sat


ZIL. New winner soon? 25-50% profit on the table.Broke out of accumulation base.
Increased volume - not good sign, move up extinguishing.
Possible retest of breakout point.
ZIL is very strong project.
Selling partially at these zones and holding the rest at least 20% in portfolio is the best case.


$ZIl Breakout. Sold at 91; Buying back the R/S retest around 81Looking for RSI to drop and bounce off the trendline. Sold my bag from 90-91; I'm looking for a re-entry around 80-82 area. A bounce there would be extremely bullish. Lots of buy volume, wouldn't be surprised if $ZIL pushed to 102-105 within the next week or two...


ZIL/BTC Small BreakoutThere’s a small breakout in ZIL. The retest of support is around 84-86 Sats. If ZIL were to breach the wedge then it would be a sell, but we are in anticipation of a bounce in this support range instead. Ideally we would like confirmation but for now it’s a Nuetral-Long

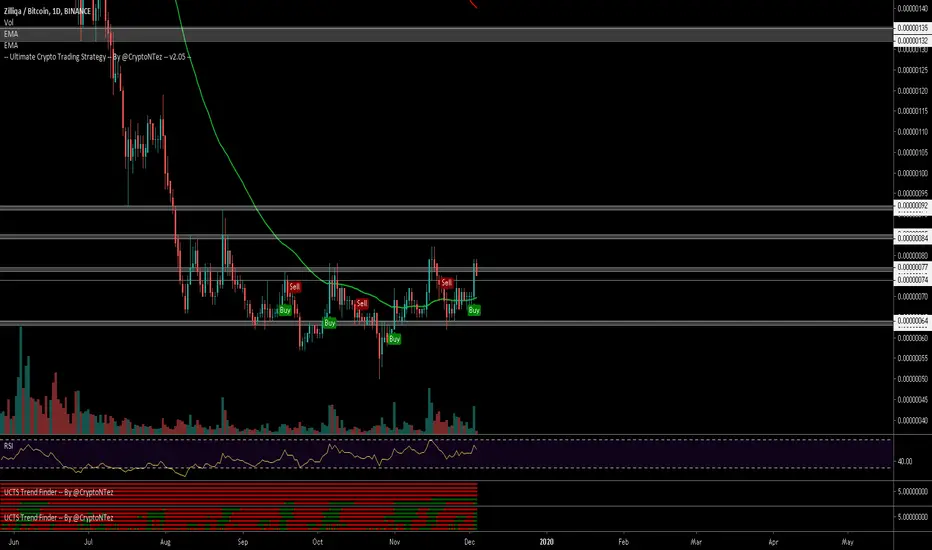
$ZIL, Showing a 2D buy signal after almost 1 year of downtrend$ZIL
Showing a 2D buy signal after almost 1 year of downtrend (crossing EMA50)
Zooming in:
Pushing and now trying to flip ~77sats resistance level, if happens can act as entry for a position with 1st target at ~84sats (10%)
Trendfinder turning green
#ZIL


ZILBTC Crazy price actionFormation of a triangle, looking for a return to the 0 fib level before upward movement returns, looks like some nasty accumulation.

ZIL/BTC Rounding Bottom, Hot Cold predictionThis ZIL/BTC chart shows a clear rounding bottom. Also, you will see in this chart that I have created a hot-cold wall to show the safe areas for a buy. Green being the safest and red being the most dangerous. This helps traders understand the more solid supports compared to others. If you are unfamiliar with rounding bottoms, the definition is below. As for now. I suggest some part of portfolio can be dedicated to a Mid to Longterm hold for ZIL. Always keep eye on BTC action, it can make or break ANY alt.
A rounding bottom is a chart pattern used in technical analysis and is identified by a series of price movements that graphically form the shape of a "U". Rounding bottoms are found at the end of extended downward trends and signify a reversal in long-term price movements.

ZIL - its over ... the end of falling :)ZIL - its over ...from falling :) lets turn different story - go go go ZIL ..up up up ,,,to the sky


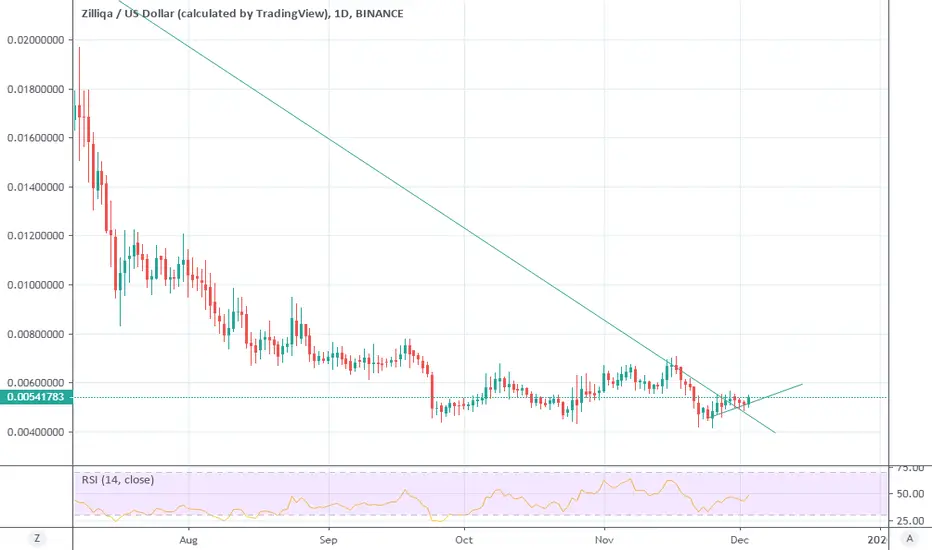

+7.6% up on the weekly chart, is Zil set for a bull run?Having clearly bottomed up from a yearly low of 0.00696753 is Zil pointing to an imminent alt season? 0.01 insight Zilliqa.

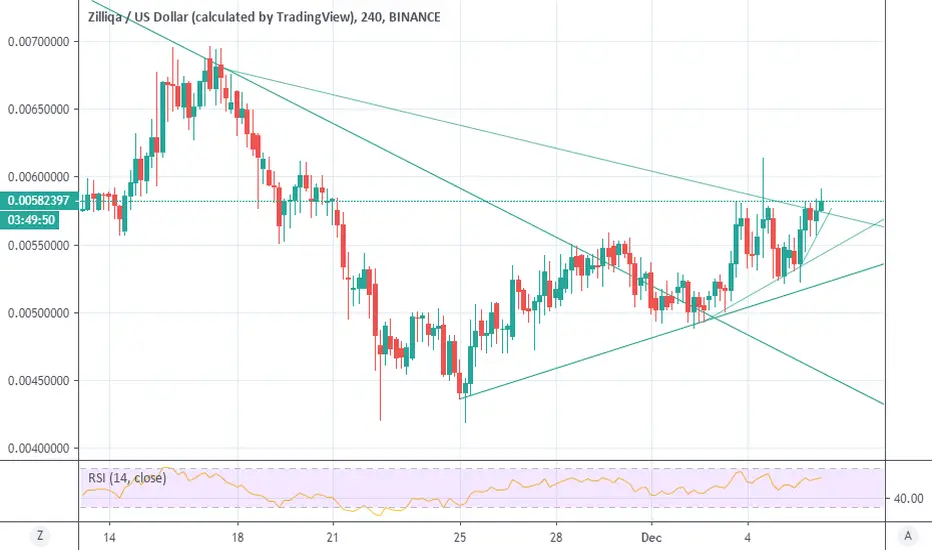
Have we seen the bottom of Zilliqa (ZIL)At least an hourly chart suggests we may have seen the bottom of ZIL; +0.008 in sight.

ZIL, Time to Fly?Buy Zil from 71-72, Rsi looks good , we need now only more Volume and it will fly.
The Targets are in the chart , After Breaking 90 Zil will fly to our Second Target. Good luck((.