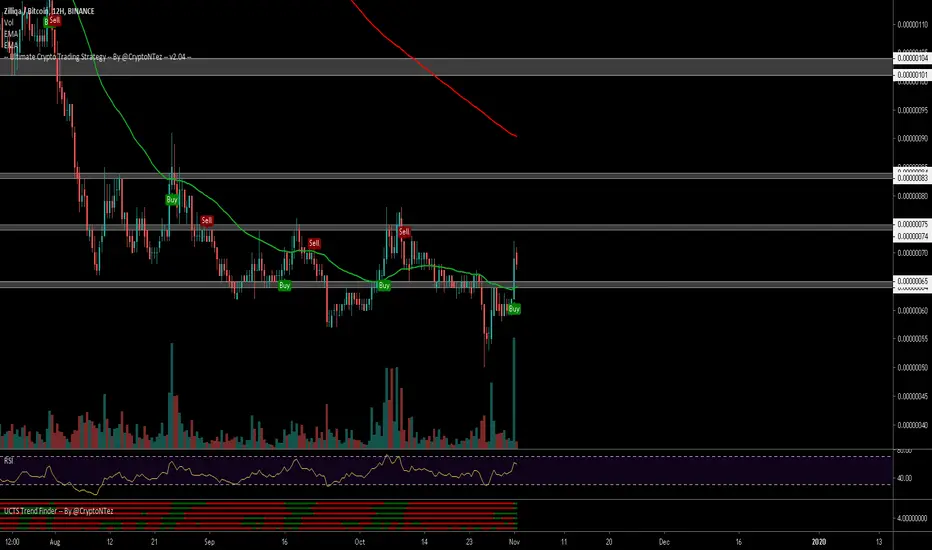
$ZIL, Crossed over ~77 sats resistance level $ZIL
Crossed over ~77 sats resistance level & now is retesting this level on lower TFs
Volume looks great & UCTS showing buy signals on the 1D & lower TFs
Looking for a flip as potential entry with target ~84 / 91sats (10/20%)
#ZIL
Zil

$ZIL, Retesting crossed ~65 sats level ..update on $ZIL
Retesting crossed ~65 sats level (this is why we always wait for retest)
If manages to flip this level into support we may have a window for a long opportunity with target at ~75sats
Volume is key so wait for it to happen aswell!
UCTS Buy signal on the 12H
#ZIL

$ZIL, Crossed over resistance level at ~65sats$ZIL
Crossed over resistance level at ~65sats & EMA50 over night with a big spike in volume on the 12H
Buying here is risky, I'm looking for a retest of this crossed level prior taking a position if it manages to flip it into support
UCTS signaling buys across multiple TFs
#ZIL
Managing my stop losses, take profits and trades over 3commas platform for Binance has been a great experience.
I have to do a few clicks and everything is managed automatically by the platform..
Thanks
Zilliqa Retrace Complete | 65%+ Move Now ImminentZilliqa (ZILBTC) just hit a new low just to quickly bounce and move back up above resistance. This is marked with a "v" on the chart.
We can see low bear/red volume on the drop but green volume growing up strong on the bounce... The bulls are now in control.
Zilliqa (ZILBTC) Chart Signals
ZILBTC is now trading above EMA10 (confirmed) and challenging EMA50 as I write this.
The trading volume is going in favor of the bulls.
The RSI is now bullish.
Bullish divergence is showing up with both the MACD and RSI.
Full green candlestick today.
The next target for ZILBTC can easily hit EMA100 or 91 satoshis (0.00000091 BTC).
The blue dashed line is the main support.
The red dashed line at the bottom is the new low/strong support.
Zilliqa is likely to grow now and move higher.
Thanks a lot for reading.
Namaste.


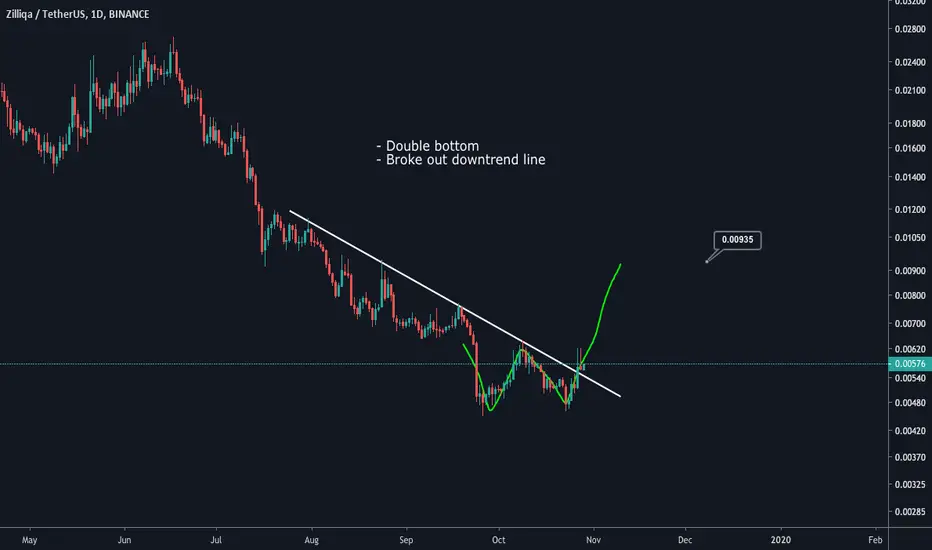
ZIL/BTC Possibly BullishFinally we see ZIL reverse and bounce back from 62 sat and potentially forming ABCD pattern.
TP1: 76 satoshi.
SL: 59 satoshi.

Zilliqa (ZIL) - 1:5 Trade @coinselorI am not a big fan of waiting for a correction (weakness) when entering a trade by applying a trend-following strategy. I wanna buy strength and sell weakness. Nevertheless, given the overall alt/btc market, it makes sense to wait for a retracement and take this 1 to 5 risk-reward ratio trade.
The reason why I wouldn't enter a position after the initial breakout high is that, as opposed to most other alts, ZIL didn't establish a well defined range before breaking out. The advantage of entering on a range breakout is that automatically that prior range high becomes a strong level of support that protects our stop/entry.

ZIL/BTC BUY SIGNALIt seems this is the last change to get Zilliqa so so cheap, especially considering recent domain service launch. ZIL to moon.


Today`s ALT!!! ZILBTCBINANCE:ZILBTC
Exchange : Binance
Coin: ZILBTC
Buy Zone: 0.00000069~0.00000066
Target Point: 0.00000072/ 0.00000077/ 0.00000081/ 0.00000085/ 0.00000091
S/L: 0.00000065
Risk: HIGH
Term: Short
As The Volume has down a lot, Symmetrical Triangle is likely to be completed soon
Not only The Chart is similar to RSI, but also Hidden Bullish Divergence
It`s time to pumping !!
=====================================================================
Today`s ALT is that information is raised regardless of the Coin market situation
So sometimes there`s a high risk trading
Investment is your responsibility.
I'm just providing about coin`s information
=====================================================================

earn 1000$ easy Price 100% difference Binance - zil - $ 0.00615
Bitfinex - zil - $ 0.012693
Arbitrators)
You can buy zil on a $ 1000 binance
translate and sell at Bitfinex for $ 2000
Earn 1000$ easy


$ZIL, Volume flowing into this asset while ~65sats level$ZIL
Volume flowing into this asset (disregarding what BTC is doing atm)
Flipped ~65sats level into support and quicly rised from there..
Above EMA50
RSI entering overbought (bullish)
If you took this signal on the 12H, you should aim for a 1st target at ~83 sats (20%+)
#ZIL

ZIL 167% - 1097%Hello
Trend line is broken and triangle pattern created and macd shows divergence.
tragets:
1)0.00000176(167%)
2)0.00000327(382%)
3)0.00000495(637%)
4)0.00000661(880%)
5)0.00008349(1097%)
Stop:0.00000043
Good luck

ZIL/BTC (Zilliqa) 150% Profit Potential..!!ZIL/BTC (Zilliqa)
- Falling Wedge Breakout in Daily Time Frame.
- MACD & RSI Both Turning Bullish.
- Need Some Volume For Healthy Uptrend.
- Need Patience For Big Gain (Might Take Time)
Buy Around 72 - 80 Sats
Sell Targets 101 - 133 - 1770 - 202 Sats
Stop Loss Below 67 Sats
Please, give us your opinion in the comments!
If you like the idea, please, hit the Like button and subscribe to the profile in order not to miss our updates.
Join Telegram Channel for more analysis - t.me
The information given is never financial advice. Always do your own research.

Dead coinDon't buy this shit we got first sell monthly signal Dead coin
16 Months of down trend they need 16 years for recovery hhhhh


ZIL breaking out with some FA and TA arguments!Today Zilliqa team announced their partnership with Chainlink, this is very strong fundamental argument to buy ZIL. Due to the news, the coin pumped out of a huge flat rectangle and now tries to form new uptrend. Targets are on the chart, buy now and thank me later!

Zilliqa vs BTC - Zilliqa's time to shine - 50+% on cardsZILBTC move up is looking good for a easy 50+% on cards for short-mid term hold.
Reasons to hold Zilliqa tightly:
Falling wedge narrowing with BTC price drop
Some major project developments and announcements in the pipeline
ZILBTC found solid support around 100-105 Sat and will aim for 23.6% once the wedge resistance is breached
Entry: Below 110
Targets:
Short Term TP1 - 125 - 127 Sats
Mid Term TP1 - 202 - 228 Sats
Stop Loss - Based on personal risk management strategy - 95 Recommended
Best Wishes

Accumulation Region? - ZILBTCThe currency is apparently in an accumulation phase in a support region of about 13 days. The RSI indicates an LTA which could mean a good trade in the next few hours. With initial target in the EMA200 region, breaking times a rest for a new ascent to the next resistance.


[ZILBTC](305%) Zilliqa Profits Coming Next! Full TradeZilliqa (ZIL) Overview
Introduced in 2017, Zilliqa (ZIL) is centered around the idea of 'Sharding' and was designed to enhance the scalability of cryptocurrency networks such as Ethereum. Sharding is analogous to the concept of 'divide and conquer', where transactions are divided into smaller groups for miners to perform parallel transactional verification. The upshot of this is the ability to reach consensus more quickly, which would increase the number of transactions in a given period. According to the white paper, transactions speed could scale to approximately 1000x that of Ethereum's network. Zilliqa’s high throughput means that developers can focus on fleshing out their ideas rather than worrying about network congestion.
Zilliqa (ZILBTC) Chart Analysis
We believe that Zilliqa (ZILBTC) will be moving really soon...
First, we have a double bottom, which is hard to see on the chart above but ZILBTC hit the same low at 0.00000132 on the 28th June and the 4th of July, normally this is a bullish pattern.
We can also see the bullish divergence on the MACD and RSI, purple arrows. Notice how the price is going down while the indicators are moving up. This is a very strong and accurate signal but it doesn't always play out, it can be invalidated.
This double bottom pattern also happens to be a new all-time low on Binance for ZILBTC, making this a retest of the low... Probabilities are high for a move to the upside here.
Let's proceed to check the trade details...
Zilliqa (ZILBTC) Full Trade by Alan Masters
Buy-in: 0.00000101 - 0.00000120
Target:
(1) 0.00000175
(2) 0.00000205
(3) 0.00000250
(4) 0.00000285
(5) 0.00000330
(6) 0.00000375
(7) 0.00000405
(8) 0.00000450
Profits potential: 305%
(Buy-in calculated at 0.00000111)
Stop-loss: Close weekly below 0.00000100.
Capital allocation: <10%.
------------
IT IS OK TO CRY, CRYING IS HEALTHY
Crying releases the pasts and opens up the doors for love.
Crying releases fear, and gives you courage and opens you to receive support.
Crying releases blocked energies and traumas… It is letting yourself go, it takes care of the old of the past.
It is ok to cry, it removes any feeling that will make you feel empty.
It is ok to cry… Crying is natural… CRYING IS HEALTHY.
Namaste.
