Zil/btc analysis using Elliott wave and harmonicZil/btc analysis using Elliott wave and harmonic and techniques analysis
BUY ZONE : 271~260
Short term TARGET : 370~401~431
Mid term target : 516~548~567~583
Stop loss : 250 or closing one candle one day below the trend
Good-luck and please share the analysis
Ziliqa


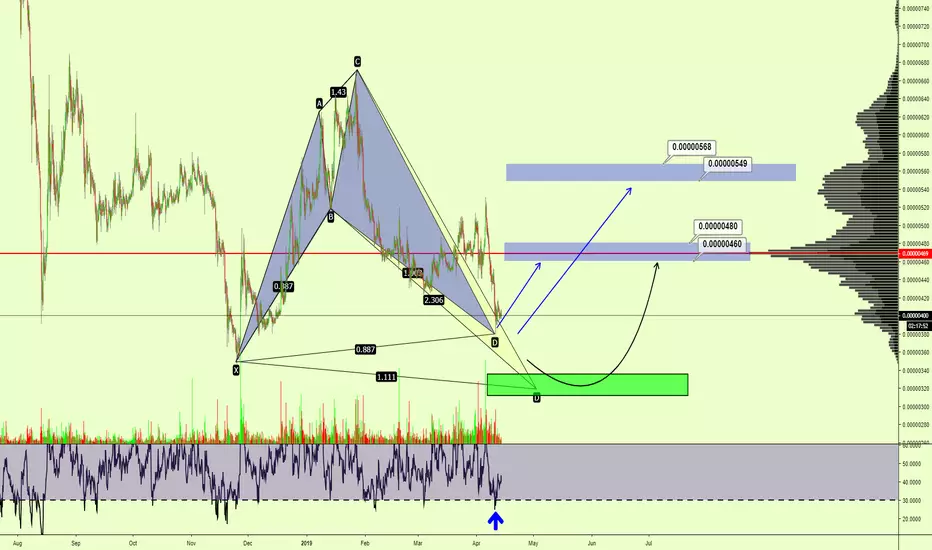
Interesting SHARK pattern on ZiliqaBuy now, set rebuy into a green box below price. Targets are on the chart. It´s some propability that we have found the bottom, but it´s risky speculation.
Ziliqa ZIL/BTCZiliqa Bitcoin Binance
clear divergence on daily
ZIL/BTC
PP: 452 s@
Tp1 670 R/R 2
Tp2 870 R/R 11.5
SL: 415 s@

Ziliqa APRIL SHOOOOT
Ziliqa now is forming a bullflag in 3D timeframe + MA bullcross will happen what means this coin will go up untill 502-522 sats zone which is aprox 7% potentialy gains from here.
Macd bullcross and we still going up slowly,Rsi is below neutral zone at the moment but i expect a breakout soon because MA will help ziliqa a little bit
First target: 500-522
Second target 587-597 sats

ZILLIQAJust yesterday, the coinmarketcap published a new rating of projects. The results are set on a scale from 0 to 1000 points and have the corresponding letter grade.
With the help of the rating it is impossible to fully evaluate projects and compare them. When analyzing a project, you should definitely conduct your own research.
Their rating will allow you to simplify the market navigation, assess the performance and achievements of the project.
Bitcoin, by the way, scored 887 points in this rating and received an A grade.
Zilliqa is also not lagging behind, the project got 787 points
For the past two weeks, the project team has focused on technical settings, as they approach the full-scale deployment of the Zilliqa Core Network.
We are waiting for the announcement of the move tokens ZIL from the team, it should appear very soon
technical analysis
We in bottom. ZILBTC formed up trend channel and now we near support line of this channel this is the best position for swing trading - position trading.

ZILBTC - ANOTHER CALL OF ZIL FOR PROFITBuy Price: Green Zone
TP: Blue Zone
Support: Orange Line
Resistance: Purple Line
SL: Red Zone (I don't recommend to sell in loss.)
Invest Suggestion: 20 Percent
Profit Expectations: 15 to 30%
See me previous analysis and how profitable the are!!!
Sell when you get some profit, according the way you trade.
Keep following us and please like this idea.
Any doubts? Send in the comments or in our telegram or Inbox here.
Thanks for visiting.

Zilliqa bitcoin. Zil/BTC Green weekZilliqa it was dip Two weeks. and doesn't able to break 470 satochi equal 0.618 fibo. candle of day is green doji above Resistance. So next week we gonna see correction
until 511 satochi if break it up with high volume the next target is 540 S.
Good luck and don't forget to support us.

ziliqa/btc ready for suprise us!Zil have a big event and main net in 31th January
in the chart it have make a wedge and break a strong resistance
we expect zil show us 0.0000071 first target
remember ziliqa not have any strong resistance after 0.0000071 ....

Ziliqa / Bitcoin (ZIL/BTC): ABC Correction On The Way?Find Winning Trades In Seconds >> efcindicator.com (Special Discount)
Ziliqa / Bitcoin (ZIL/BTC): All The Supports, Pivots & Resistences – Short-Term

ZILBTC Make Inverse Head And Shoulder Pattern On 4 Hr ChartZILBTC Make Inverse Head And Shoulder Pattern On 4 Hr Charton Binance Exchange

ZIL : Zilliqa Next Wave is 60 % !!ZIL is Very Potentional Coin You Can Buy ZIL Between 420-430 and Sell 600 & 700.
You Can Also set Own Risk reward.
Let see what Will be Next Move.
Warning- I m Not a Financial Advisor this idea Only For Educational Purpose Only.
Thank You !!

Ziliqa ready to breakout? Ziliqa looks ready to break out. Buy if a 4-hour candle closes above resistance line.
The candle will close in 30 minutes. SL is in the chart.


ZIL BTC Breakout FAILEDZiliqa against BItcoin is situated into a bullflag but in my opinion this is a failed bullflag because was taked too long to make a breakout.Volume also is going down which is a bearish signal
RSI is situated into bearish zone
Stochastic we can see a bear cross
EMA bear cross soon which will result into a breakdown
Supports here is really thin so i expect a drop minimum to 370-366 sats and 349 or below.
!!! This coin is good to accumulate for 31 january 2019 till mainnet launch

ZILBTC PROFIT IS COMMING!Buy Price: Green Zone
SL: Red Line
Profit: Blue Lines!
Invest Suggestion: 20 Percent
Profit Expectations: 5 - 10 - 20 Percent
Looking at the chart of ZIL, we could see that is near of it historical low!!
We Have the 13 HMA crossing the 34 HMA and probably will cross the 50 HMA , indicating that we have a growth tendency!!
MACD lines crossed too and ANN strategy is in green zone!
Sell when you get some profit, according the way you trade.
Keep following us and please like this idea.
Any doubts? Send in the comments or in our telegram or Inbox here.
Thanks for visiting.

ZILLIQA :ZIL See Chart 500% !!ZIL Buy Around 400 Satoshi , Hold For LongTerm and Sell 2500 satoshi .
Share Your Opinion in Comments.
if You Satisfied With My idea Then Dont Forgot To Hit Like.
Warning- I m Not a Financial Advisor this idea Only For Educational Purpose Only.
Thank You !!

ZILBTC H4 BINANCE UP TO 25% UPSIDE, SPECULATIVE SETUP.ZILBTC H4 BINANCE UP TO 25% UPSIDE, SPECULATIVE SETUP. DETAILS SEE CHART (TARGET).

$ZIL, F*** Sleep, Come Clean…
Weekly
Looking at our trend timeframe we see price continues to respect our down trend, stochastic rsi showing momentum starting to shift in favor of bulls. Support has been found at 500 satoshis, last time we were at this price was back in March. The run in March went from 500 to 2000 within a couple of weeks, will watch smaller timeframe for entry.
Daily
Shifting over to our pattern timeframe we see today’s candle opened at 559 with a high of 561 satoshis. Resistance found at 570, a daily close above this level activates our trade. Expecting price to retrace towards 500 for a retest, depending on momentum we could see a sell off towards 450. Sitting on my hands until a daily close above 570, or a bounce off 450.

ZIL BTC SWING TRADEZIL HOLD their support line and also we closed above ichimoku cloud which is bullish signal
Macd is situated into positive ZONE and we are waiting for bull cross
RSI above 50=bullish
Stoch bull CROSS
Targets given in the chart.
Stoploss 537

Daily Bullish Signal $ZIL #ZILBTC (15-10)#ZIL (ZIL/BTC)
Buy : 525
Flash Sell : 540
Short Sell : 580
Long Sell : 600-620-640-660-680
Stop : 490
Follow me for more signals daily

ZILIQA READY TO TAKE OFFZiliqa looking so good right now. Cloud turning to green. Ready for breakout from cloud. Moving averages shows good up momentum. Waves so clear. Lagging orange line above the price.

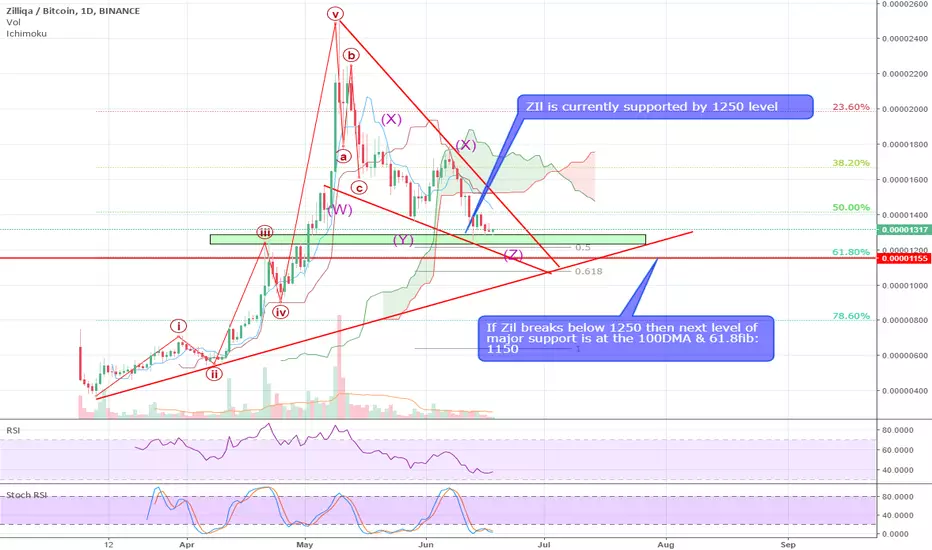
#Zilliqa #ZIl update#Zilliqa #ZIl is currently supported by 1250 level, RSI in 1D is at 36, which is not oversold yet.
If Zil breaks below 1250 then next level of major support is at the 100DMA & 61.8fib: 1150, below that we have the uptrend line support at 1080.