Zilliqa Bull pattern 23% Zil/USDHi Guys like everyday i'm supporting famous Token Today shape of zilliqa Is awesome. we've cup & hand if we're break out neck the shape the next target is 23% equal 0.025 USD. s
Ziliqabitcoin

ZIL/BTC - Zilliqa ready to move again?I think there is potential 50%+ profits. (Just my opinion!)
Buy zone: 450 - 480 sat Stop-loss: 440
Target 1: 550
Target 2: 600
Target 3: 650
Target 4: 750
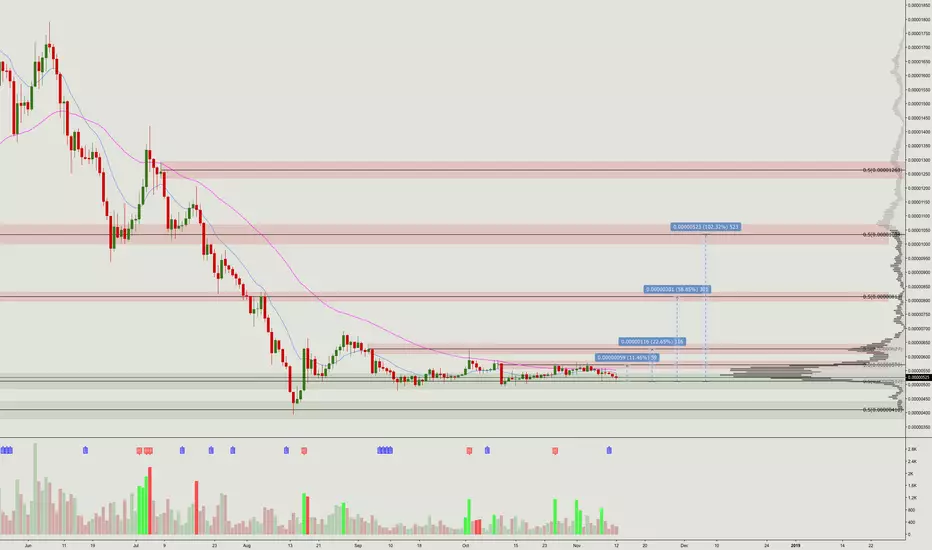
ZILBTC BINANCE 1D up to 13FEB19 Trading Analysis (TA)ZILBTC Zilliqa / Bitcoin BINANCE 1D up to 13FEB19 Trading Analysis (TA)
1D Chart, Zilliqa (ZIL) started its correction after reaching the 0.0000641BTC (1), rolling down from 65 RSI (2) and the MACD over the Histogram (3), piercing down the 100/200 MA signals (4), and looks like found support on the 33 RSI line (5), which is the optimistic approach, but remember "In this business if you're good, you're right six times out of ten. You're never going to be right nine times out of ten. I've found that when the market's going down and you buy funds wisely, at some point in the future you will be happy. You won't get there by reading 'Now is the time to buy.'" . At this time the Market Cap is around 118b. Good Luck!
1D Chart, Zilliqa (ZIL) comenzó su corrección después de alcanzar 0.0000641BTC (1), descendiendo desde la linea de 65 RSI (2) y el MACD sobre el histograma (3), perforando descendentemente las señales de 100/200 MA (4), y parece que ha encontrado soporte en la línea 33 RSI (5), que es el enfoque optimista, pero recuerde "En este negocio, si es bueno, tiene razón seis veces sobre diez. Nunca tendrá razón nueve veces sobre diez. He descubierto que cuando el mercado baja y compro fondos sabiamente, en algún momento en el futuro se siente la felicidad. Pero para llegar a ese momento nunca leerá una señal que diga: "Ahora es el momento de comprar" . En este momento el Market Cap esta alrededor de 118b. ¡Buena suerte!
“I believe in analysis and not forecasting.” / "Creo en el análisis y no en el pronóstico".
REMEMBER: I am not a financial adviser nor is any content in this article presented as financial advice. The information provided in this blog post and any other posts that I make and any accompanying material is for informational purposes only. It should not be considered financial or investment advice of any kind. One should consult with a financial or investment professional to determine what may be best for your individual needs. RECUERDE: No soy un asesor financiero y el contenido de este artículo no se presenta como asesoramiento financiero. La información provista en esta publicación de blog y cualquier otra publicación que haga y cualquier material que la acompañe es solo para fines informativos. No debe considerarse asesoramiento financiero o de inversión de ningún tipo. Se debe consultar con un profesional financiero o de inversiones para determinar qué es lo mejor para sus necesidades individuales.

Zilliqa bitcoin. Zil/BTC Green weekZilliqa it was dip Two weeks. and doesn't able to break 470 satochi equal 0.618 fibo. candle of day is green doji above Resistance. So next week we gonna see correction
until 511 satochi if break it up with high volume the next target is 540 S.
Good luck and don't forget to support us.


ZILBTC Zilliqa/Bitcoin Binance 1D 2/4/19 Trading Analysis (TA)ZILBTC Zilliqa / Bitcoin Binance 1D up to 04FEB19 Trading Analysis (TA)
1D Chart, Zilliqa (ZIL) by december 21, was able to break over both the 100/200 days MA signals, along with an ascending movement from 40 RSI over 70 RSI surfing over this last until January 13, when felt and found support on 50 RSI and above the 200 MA, bounced back, increased its price and now is testing again the 50 RSI and now above the 100 MA signal which pierced the 200 MA in an ascending movement, if it finds support here, should bounce back over 0.0000650BTC, but if breaks down 50 RSI and/ or reaches the 100 MA, should be time wait until it finds support somewhere below 50 RSI or below the 100/200 MA signals. Here we are! Testing the 200 MA / 36 RSI support in order to move toward the 100 MA, which is the optimistic approach, but remember "Trees don't grow until the sky" it can find resistance and make a correction anytime. At this time the Market Cap is around 112b. Good Luck!
1D Chart, Zilliqa (ZIL) para el 21 de diciembre, pudo atravesar ascendentemente las señales MA de 100/200 días, junto con un movimiento ascendente de 40 RSI a 70 RSI surfeando sobre este último hasta el 13 de enero, cuando hizo una correccion y encontró soporte en 50 RSI y por encima del 200 MA, se recuperó, aumentaron su precio y ahora están probando nuevamente el 50 RSI pero ahora por encima de la señal de 100 MA que perforó ascendentemente el 200 MA, si encuentra soporte aquí, debería recuperarse por encima de 0.0000650BTC, pero si rompe 50 RSI y / o alcanza el 100 MA, toca esperar un tiempo hasta que encuentre soporte en algún lugar por debajo de 50 RSI o por debajo de las señales 100/200 MA. ¡Aquí estamos! Probando el soporte de 200 MA / 36 RSI para avanzar hacia los 100 MA, que es el enfoque optimista, pero recuerde que "los árboles no crecen hasta el cielo" pueden encontrar resistencia y hacer una corrección en cualquier momento. En este momento el Market Cap está alrededor de 112b. ¡Buena suerte!
“I believe in analysis and not forecasting.” / "Creo en el análisis y no en el pronóstico".
REMEMBER: I am not a financial adviser nor is any content in this article presented as financial advice. The information provided in this blog post and any other posts that I make and any accompanying material is for informational purposes only. It should not be considered financial or investment advice of any kind. One should consult with a financial or investment professional to determine what may be best for your individual needs. RECUERDE: No soy un asesor financiero y el contenido de este artículo no se presenta como asesoramiento financiero. La información provista en esta publicación de blog y cualquier otra publicación que haga y cualquier material que la acompañe es solo para fines informativos. No debe considerarse asesoramiento financiero o de inversión de ningún tipo. Se debe consultar con un profesional financiero o de inversiones para determinar qué es lo mejor para sus necesidades individuales.


ZILBTC Binance 1D up to 27JAN19ZILBTC Binance 1D up to 27JAN19
1D Chart, Zilliqa (ZIL) by december 21, was able to break over both the 100/200 days MA signals, along with an ascending movement from 40 RSI over 70 RSI surfing over this last until January 13, when felt and found support on 50 RSI and above the 200 MA, bounced back, increased its price and now is testing again the 50 RSI and now above the 100 MA signal which pierced the 200 MA in an ascending movement, if it finds support here, should bounce back over 0.0000650BTC, but if breaks down 50 RSI and/ or reaches the 100 MA, should be time wait until it finds support somewhere below 50 RSI or below the 100/200 MA signals. At this time the Market Cap is falling bellow 114b. Good Luck!
1D Chart, Zilliqa (ZIL ) para el 21 de diciembre, pudo atravesar ascendentemente las señales MA de 100/200 días, junto con un movimiento ascendente de 40 RSI a 70 RSI surfeando sobre este último hasta el 13 de enero, cuando hizo una correccion y encontró soporte en 50 RSI y por encima del 200 MA, se recuperó, aumentaron su precio y ahora están probando nuevamente el 50 RSI pero ahora por encima de la señal de 100 MA que perforó ascendentemente el 200 MA, si encuentra soporte aquí, debería recuperarse por encima de 0.0000650BTC, pero si rompe 50 RSI y / o alcanza el 100 MA, toca esperar un tiempo hasta que encuentre soporte en algún lugar por debajo de 50 RSI o por debajo de las señales 100/200 MA. En este momento el Market Cap está cayendo por debajo de 114b. ¡Buena suerte!
"Bitcoin will do to Banks what Email did to Postal Industry / El Bitcoin le hara a los Bancos lo mismo que el Correo Electronico hizo a la Industria Postal"

ziliqa/btc ready for suprise us!Zil have a big event and main net in 31th January
in the chart it have make a wedge and break a strong resistance
we expect zil show us 0.0000071 first target
remember ziliqa not have any strong resistance after 0.0000071 ....

ZIL/BTC CUP and Handle 1HOn 1Hr graph forming Cup and Hande.........maybe good chance to next moved Up

ZILZIL
-MACD looks like its coming for an up cross
-We are in the ichi cloud, if we will the gap and use the green top for support we will see movement
-Lower highs and higher lows
It looks like we may see it come down just a bit before we breakout. 582-585 region.

ZIL/BTC prepare for mainnet startBecause mainet starting at 31. January then I thing that next move on Zil is will going uptrend.
SL: 505
TG1: 575
TG2: 640
TG3: 720


ZILBTCzilliqa it has now began in wave elliott. with a small correction at 523 Satoshi. we gonna flight to touch 660 satoshi. equal to moving average 200 ON 1 day.

ZIL : Zilliqa Next Wave is 60 % !!ZIL is Very Potentional Coin You Can Buy ZIL Between 420-430 and Sell 600 & 700.
You Can Also set Own Risk reward.
Let see what Will be Next Move.
Warning- I m Not a Financial Advisor this idea Only For Educational Purpose Only.
Thank You !!

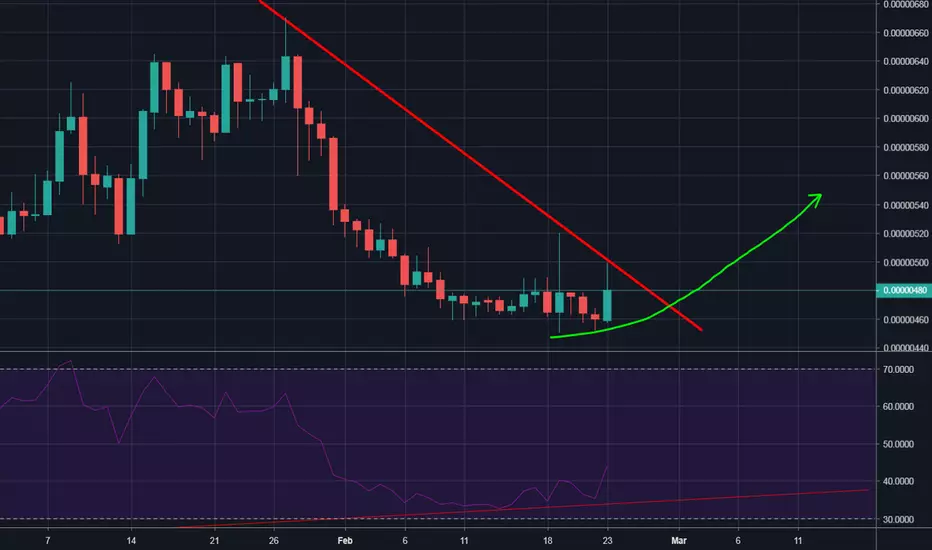
ZIL/BTC wait to break trendlinewait to break ascend trendline
maybe good profit on bear market
SL: 385
TG: 480

Long first retest of support on ZilliqaThe plan here is to long the first retest of support at around 376 sats.
I'm hoping that the support level where price is currently will fail for a nice opportunity to long the next level under.
TP is at what i think is the next closest strong resistance.
All ive used here is simple horizontal support and resistance lines, lets see how this goes.

ZILBTC PROFIT IS COMMING!Buy Price: Green Zone
SL: Red Line
Profit: Blue Lines!
Invest Suggestion: 20 Percent
Profit Expectations: 5 - 10 - 20 Percent
Looking at the chart of ZIL, we could see that is near of it historical low!!
We Have the 13 HMA crossing the 34 HMA and probably will cross the 50 HMA , indicating that we have a growth tendency!!
MACD lines crossed too and ANN strategy is in green zone!
Sell when you get some profit, according the way you trade.
Keep following us and please like this idea.
Any doubts? Send in the comments or in our telegram or Inbox here.
Thanks for visiting.

ZILLIQA :ZIL See Chart 500% !!ZIL Buy Around 400 Satoshi , Hold For LongTerm and Sell 2500 satoshi .
Share Your Opinion in Comments.
if You Satisfied With My idea Then Dont Forgot To Hit Like.
Warning- I m Not a Financial Advisor this idea Only For Educational Purpose Only.
Thank You !!

ZIL/BTC LongUptrend is starting
strong project
strong potencial
good for HOLD
+ Q4, 2018: Testnet v3.0
+ Q1, 2019: Mainnet launch
please send me our opinion

Zillqa (ZIL) BREAKOUT INCOMING!?! 600% PROFIT POTENTIAL!?!Hello all my friends in the crypto world! I would like to thank you all for liking and following my content!!! If you haven't liked or followed me yet please do as it helps me reach other traders that would value this content. Thanks
ZILLQA OVERVIEW
This could could be continuing market cycle of April 2018 breakout.
We must see volume increase and see price stabilize above 524 and at least move sideways to get farther past downtrend line!
I will not add to much more info to this post as everything you need to know is in the chart!

ZIL accumulated and ready to POP!
ZIL has been in accumulation mode for a couple months and it looks primed for some hefty gains
EMAs continue to trend lower and currently proving to be resistance
Upcoming catalyst: Q4 2018 is their Dapp release and Q42018/Q12019 will be the launch of their Mainnet
We could see price start to jump into those 2 events
This demand zone is a good spot to start adding to a position or initiated one
BTC looks weak right now so a better entry is possible if one wants to wait this out
Thanks guys!