a clearly divergenceRSI and OBV show us higher low and the price is lower low that's Bullish divergence
Zilliqa

Zilliqa (ZIL) formed bullish Gartley for upto 13%Hey dear friends, hope you are well, and welcome to the new trade setup of Zilliqa coin with Bitcoin pair.
On a 4-hr time frame ZIL has formed bullish Gartley pattern.
Note: Above idea is for educational purpose only. It is advised to diversify and strictly follow the stop loss, and don't get stuck with trade

Zill Buying Map :PWatch the blue squares! thats where i might be buying ZILL.
Gotta hold those levels. otherwise... rip us :P and rip zill

ZILUSDT ZILLIQA CHARTTrading Signal:
There is a Trading Signal to Buy in ZILUSDT Zilliqa.
Traders can open their Buy Trades NOW
⬆️Buy now or Buy on 0.04335$
⭕️SL: 0.0345$
🔵TP @ 0.05317$
What are these signals based on?
Classical Technical Analysis
Price Action Candlesticks Fibonacci
RSI , Moving Average
#AMINE_CHEBBI

ZIL WILL EXPLODE!!!!!! This is long term analyse. I Believe in this project more for long term. Do you think we will hit our target at $58?

zilusdt hi, my nickname is Sad. i hope you do not use my analysis as a criterion for buying or selling. i wish you always be profitable. and follow my account.
if stabilized and floored, it has the potential to start a new upward movement.

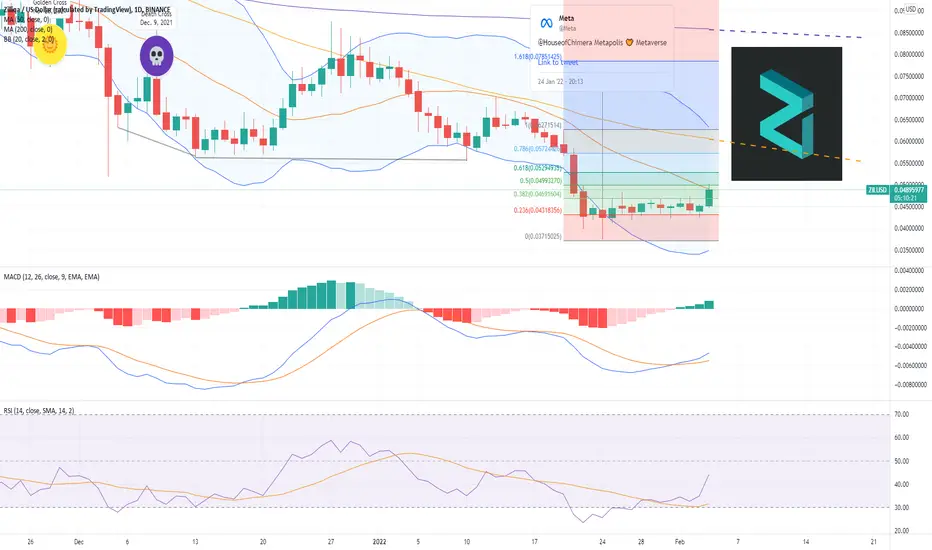
Zilliqa Reaction To The Current MarketZilliqa has been bouncing on .618 Fib zone after a long while and now its retesting that level once again. Depending on Bitcoin move and the break of 200 SMA, we might see more upside for Zilliqa.

Can ZIL break the resistance in JUNE 2022?There is a resistance line for ZIL, if the market is going to recover after this spring, can we see ZIL break the resistance in June as well?
If anything wrong happens and the volume starts to come in, I don't see why not.

5 Key Levels of Resistance for $ZIL These are my 5 key levels to break for Zilliqa to clear the path to new all time highs.
1. Downtrend since Nov. 10th
2. High liquidity zone of resistance
3. Downtrend since Sept. 5th
4. Psychological resistance of $.10 ($.096)
5. High made in Sept. Horizontal Resistance.

Zilliqa ($ZIL) DTF$ZIL Big Wick Energy meets $0.0499 FIB resistance with amazing buying pressure. We need to attack the $0.0572 FIB level with a close and confirm to keep the BULL-mentum going
ZIL falling wedgeZil looking good with price forming a bullish falling wedge on the weekly timeframe!

Zilliqa ($ZIL) DTF FIB$ZIL DTF continues to chop between $0.043 FIB support and $0.0469 FIB resistance. $ZIL has a long of work to do but I am adamant that the best is yet to come. Let's touch that 50MA!

$ZIL Not all is lostPrice broke through the trend line, which brings negative thoughts. However, there is still a chance for growth, the price touched the bottom bolinger line (last time it happened we saw a 30% growth), if bitcoin does not continue to fall the ZIL has all chances to return to levels above the trend line.
Nearest resistance zone: 0.049-0.059;
Support zone 0.025-0.03;

Awaiting reversalseems like correction coming to its end
maybe one more dip is left. just an idea :_)

Potential 4x Long Term: Great set up at a high demand regionPost #2
We can see an opportunity to go LONG at the Demand Region illustrated on green ( I called it buying zone). #Zilliqa has shown great results past bull rallies. Currently the price is below a very strong support and as of today, it appears that Zilliqa can get to the Buying zone and beyond.
In the Take Profit zone illustrated in yellow you can either close your position or take some profits and let it continue to climb.
Upward green arrow showing the potential, should Zilliqa get to and above buying zone.
Downward red arrow showing the potential, should Zilliqa bounce back from buying zone.
MY OPINION:
Keep an eye on this crypto. Remember that this is for long term investment, however, trades at a strong support can be very profitable.

$ZIL long term prediction$ZIL have lot of potential, in technical and fundamental. i think it will be good to hold for next few months
Trade responsibly
Invest responsibly

Zilliqa possible recoveryZilliqa is L1 blockchain which supports smart contracts on it's native language Scilla. It's ecosystem is constantly growing so I see a good future for this project.
During next 3 months they also plan to start a metaverse project on Zilliqa blockain (Metapolis) and Zil will be it's main coin.
Of course everything depends from btc, if it goes down all market will go down. We're still in a local downtrend, but I hope soon we will see a recovery from it.
Please note, this is not a financial advice, I just share my opinion.

Zilliqa ZILUSDT - Descending triangle + Another 40% drop coming!- On the weekly chart we can spot a descending triangle, the most bearish technical pattern.
- Currently, the triangle is breaking down with strong bullish momentum.
- Another 40% drop is very likely at this moment.
- Next support is bottom of the blue trendline and horizontal line from 2019.


ZIL USDT double bottomSimilar to BAT chart I posted recently, but this one didn't break above the resistance trendline yet. Indicators high so watch for pull-back or retest entry. Support is tested more times in the past so we may assume that this will be bottom. (If king do not throw some more s..t at us by dumping more). Set alarms. Good luck traders

Zil- Double BottomBuying Zil here- zil is sleeping giant. It is going to explode soon, super strong fundamentals, and same will be shown in charts also.

Accumulate: ZilliqaChart Pattern: Cup and handle formation
Strategy: BTFD + Stake (accumulation/waiting game)
Catalyst(s): Release of Metapolis this Q1 202 | L1 storyline

Zilliqa (ZIL) broke out channel for next pumpHi dear friends, hope you are well and welcome to the new update on Zilliqa (ZIL).
Triangle and double bottom:
For a long-term period, on a weekly time frame the priceline of Zilliqa is moving in a descending triangle. Now it is at the support of this triangle and there is also 200 simple moving average support as well. The priceline is also at the lower bands of Bollinger bands. Therefore, this is very strong support and lifeline for Zilliqa. The stochastic is also oversold. Zilliqa is also forming a double bottom at this support, which can be another indication for the price reversal from here.
Broke out the channel:
On a 4-hr time frame, Zil has broken out a down channel.
Note: Above idea is for educational purpose only. It is advised to diversify and strictly follow the stop loss, and don't get stuck with trade
