Zilliqa, Massive Descending-Triangle, Breakout Incoming!Hello,
Welcome to this analysis about Zilliqa, we are looking at the 6-hour timeframe perspectives. Zilliqa in the previous bearish developments with which the cryptocurrency market has shown up unless other cryptocurrencies moved below the previously established supports of 0.06 and formed a new lower low which does not mean Zilliqa can not recover from this and in fact after the new lower low was formed Zilliqa bounced back and initially recovered in the structure which was firstly a good sign. Besides that I discovered the main formation that will play an important factor in the near future, therefore I detected all the important levels and likely determinations we should consider with Zilliqa.
Structural Developments:
As when looking at my chart we can watch there how Zilliqa established this paramount descending-triangle-formation with the coherent wave-count in the formation already completed with the waves A to E in the schedule which firstly completed the wave-count and therefore serves as a part of completing the whole formation. As Zilliqa now approaches the upper boundary of this major descending-triangle-formation this is a possible test for a breakout especially as the 65-EMA in green is also tested. Furthermore, since Zilliqa bounced in the 0.05 level there came some decent solid volatility into the place from which Zilliqa has the ability to build up on and increase volatility that leads to the breakout-confirmation of this main formation.
Upcoming Determinations:
Taking all these factors into the consideration now Zilliqa is in a situation in which it has developed this great descending-triangle-formation which in most occasions is a bullish reversal formation that indicates the final bullish reversal and continuation to the upside. The only thing that remains now is the final validation of this whole formation which will happen when Zilliqa breaks out above the upper boundary of the formation and in this case also importantly above the 65-EMA in green to move on and test the 100-EMA in red. When this suggested breakout is finally established Zilliqa will activate the upside targets within the dynamic-descending-triangle-target-zone and when these are reached the situation needs to be elevated anew.
In this manner, thank you for watching my analysis about ZILLIQA and the main descending-triangle-formation likely to be the origin of an upside-breakout and increased volatility coming into, great when you support it with a like and follow or comment for more market insight!
Information provided is only educational and should not be used to take action in the market.
Zilliqa

ZIL in 1D | Great Situation for Shortthis is not a signal. Its just my opinion. Dont open your positions Based on my ideas! BINANCE:ZILUSDT
💎 #ZILUSDT
⌛️ #D
💲:entry_price : 0.059
🎯 targets:
TP1:0.048
TP2:0.045
📈 #SHORT
🚫stop_loss: 0.065
✖️Leverage: 5x
🔳Capital: 3%
💠Details: Zil is breaking its Static Support and 1.618 line of its pitchfork. the next target is mentioned on the chart.
zil coud not break its dynamic Resistance. so i expect a good short position

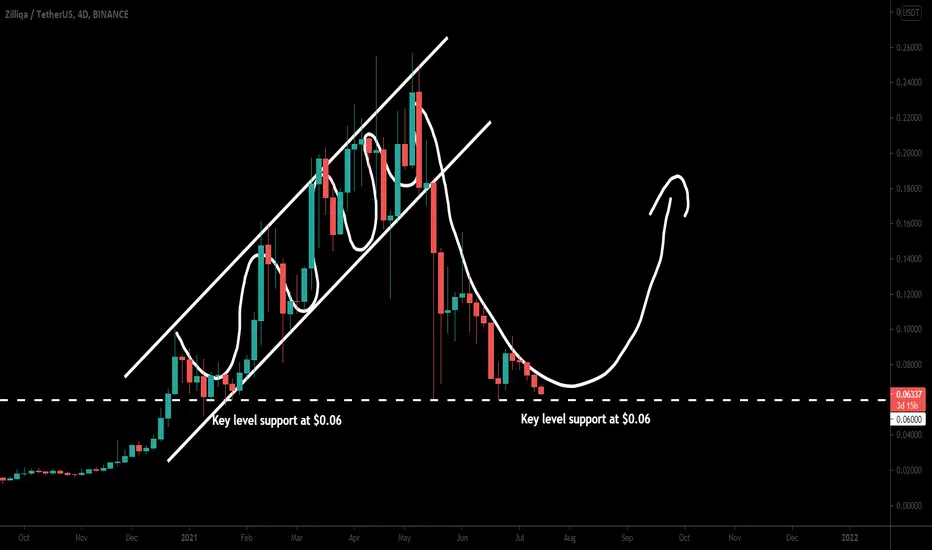
It Can Be Another Classic Move Of Zilliqa (ZIL)Brokedown the channel and key level support:
The price action of the Zilliqa coin was previously moving in a very long up channel. After breaking down the support of the channel the priceline turned is very strong bearish but found very strong support at $0.06. The $0.06 is key level support for the price line of is Zil. Because it has been working previously as very strong support for the price action for a very long time period. It can be seen that before the formation of the up-channel for several days the $0.06 level has been working as very strong support. Therefore, it will be very difficult for the PI fine to break down the support.
Big bullish BAT:
On the weekly time frame chart, the price action has formed a bullish BAT.
The buying targets as per the Fibonacci sequence of this bullish BAT can be as below:
Buy between: $0.0948 to $0.0745
Sell between: $0.1433 to $0.2161
As per the above targets, this trade has a profit possibility of up to 190%, and the loss possibility is 22%. It can be seen that on the weekly chart, the priceline is moving below the potential reversal zone of the bullish BAT but there is a very strong key level support at $0.06. Therefore, we can set this level as stop loss, rather than the maximum extent of the potential reversal zone and follow the sell targets as per the bullish BAT pattern.
Zilliqa (ZIL) formed bullish BAT for upto 30% moveHi dear friends, hope you are well and welcome to the new update on Zilliqa (ZIL).
On the daily time frame chart, the price action has formed a bullish BAT.

$ZIL DEVELOPMENTSzilliqa at the 50 week moving average of lows - will this become support?
3 weeks of positive macd histogram

#ZIL - 0.10 usd!! 50% BULLISH MOVE COMING ON ZIL 13 to 1 RR!! #420Investments
Please find my analysis of Zil 4 hour time frame below.
Entry - Current Price Action $0.07300
Stop Loss - $0.0700
Target - $0.10
Risk to Reward - 13 to 1
Candle Stick Patterns -
4 Hour SFP Reversal Pin
High Time frame support confirmed.
Zil has a really big move incoming guys, this is a must take trade.
see you on the other side!

ZILUSD Micro gains before macro gains. Great Ecosystem.Nicely undervalued project with a powerful ecosystem. Bullish in short and long-term. Go Zilliqa.

Zilliqa Price Projection 3/Jan/2022 using Gann FanA little forecast for the excellent #Zilliqa community. It all crystal balls and finger in the air stuff. Would be good to see this play out by EOY.

Zilliqa: 30% rise on the way ? I'm opening a long position on Zil/USDT.
We are potentially in a double bottom pattern and we've formed a bullish divergence.
I have multiple take profit target and as always, a tight stop loss
One should be careful considering that we have a death cross on the daily timeframe.

zilliqaSUPPORT AND RESISTANCE LEVELS ARE SHOWN WITH RED DOT LINE AND RED BOXES. WATCH OUT AND READY TO TAKE POSITION.

ZILLIQA BREAK THE IMPORTANT LEVEL!!In this Technical Analysis, I would like to tell you guys that we already broke the Descending Triangle Pattern on 4H Timeframe, and also the Ascending Channel Support on Daily Timeframe.
This actually could sign a very bad situation on Zilliqa.
However despite of this bad situation I also found an interesting pattern.
It's a Falling Wedge Pattern on the Daily timeframe.
This actually can be good for Zilliqa. At least we now can see the possible Resistance for Zilliqa move in the next few days.
Disclaimer : This is not Financial Advise

DESCENDING TRIANGLE PATTERN ON 4H CHART!!If we looking at this this chart, the price is forming a pattern that we called as Descending Triangle Pattern.
This could indicate a bearish movement if the Support couldn't hold.
But, in the daily timeframe, we also expecting a strong rebound since the price is near the Support Line from Ascending Channel.
Disclaimer : This is not Financial Advise

ZIL/USDT- Will be break and out of the channel soon.
- We will see consoludations in channel.
- Action depends on volume .
- Targets signed.
*Please share your opinion on it, write in the comments.
Teşekkürler.

$ZIL bottomed, decent trade but missed the ideal entry$ZIL has made a double bottom and back above daily support. ideal entry would have been 10168 satoshis, but it still offers a decent risk/reward trade if taken now. Alternatively it's also possible to wait for it to retrace a bit which would define a higher stoploss and offer a better R/R (but more risky) trade

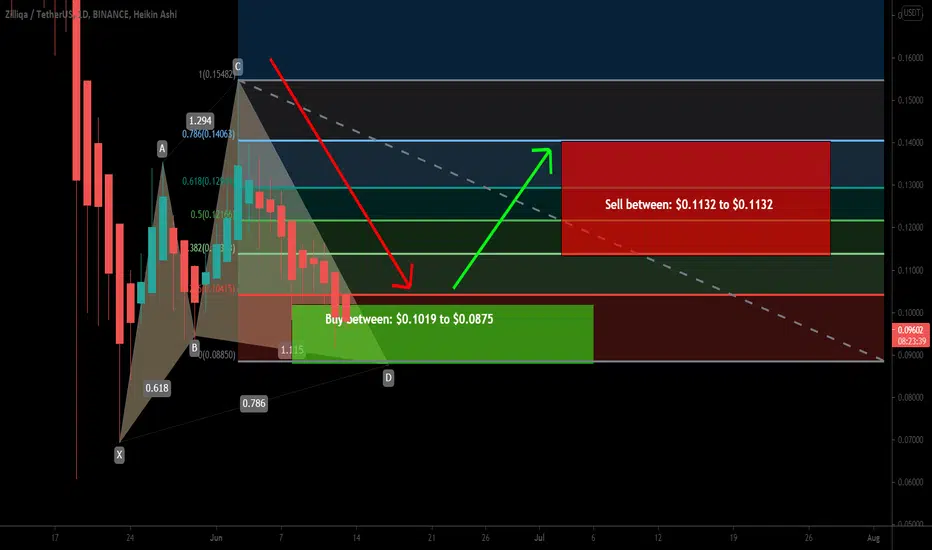
Zilliqa formed Cypher for upto 29% bullish moveHey dear friends, hope you are well, and welcome to the new update on Zilliqa (ZIL) coin with US Dollar pair.
Previously we had a nice trade of ZIL coin on 26th May:
Now on the daily time frame chart, the price action of ZILLIQA has formed a bullish Cypher pattern.
Buy and sell targets:
Buy between: $0.1019 to $0.0875
Sell between: $0.1132 to $0.1132
Stop loss:
The maximum extent of potential reversal zone $0.0875 can be used as stop loss.
Possible profit and loss ratio:
As per the above targets, this trade has a big profit possibility of 29%, and the loss possibility is 14.5%.
Note: Above idea is for educational purpose only. It is advised to diversify and strictly follow the stop loss, and don't get stuck with trade.
THERE IS A BIG CHANCE FOR ZILLIQA TO DROP FURTHERBased on the Bitcoin Dominance, that surging about 2% today, giving impact to Alt Coins because of the market start shifting back to Bitcoin.
The Alt Coins start to suffer, everyone keep asking me why Alt Coins are dropping meanwhile Bitcoin gain today??
The answer is BTC Dominance, therefore as you can see on the Chart, not much to say for Zilliqa besides of it will dropping further.
The only thing that we can do right now is preparing for the worst on Zilliqa, stay away from the market as right now it's dropping so fast like a falling sharp knife.
Be careful and be aware of potential bottom on every token right now.
Good luck!!
Disclaimer : This is not Financial Advise.

ZIL bullishZIL at 360 resistance and look bullish to get above it today. Buying some here and leaving average cost order at 315 in case of rejection and dump. That will allow to reduce position size or exit it fully at 335 SR.
Day chart for zoom out view (mainly because of day chart I assume drop to 300-315 is possible)


Zil Final TargetBased on the Fibonacci timeline and the one-year Zil channel
I imagine such a scenario for Zil
I think Zils final target is between 5.2 and 6 or even 6.4
But about 5.5 $ seems to be closer to reality.
good luck

ZIL the leading indicator of the marketHi crypto traders,
ZIL has been a leading indicator for the market direction. We have just finished the C wave of the Wave 4. We are getting started with a new mega wave that may bring us more than 10x from here. This is a great time to accumulate ZIL or at least keep an eye on this coin for when the bull market may end.
Cheers!

#zilliqa with the same Rocket pattern#zilliqa with the Rocket pattern
almost the same pattern , high up to the sky

#zilliqa I saw this pattern before, didn't you ?!we already entered #ziliiqa from 0.02 (check related idea)
and I think that it will launch soon with long term targets defined also (in the related ideas ).
so let's watch it carefully
and most importantly , manage your risks
and more importantly , NEVER forget to give this idea one single like

