Zilliqa is looking good because... #ZILUSD #ZILUSDT $ZILHi All! 🤚🏼
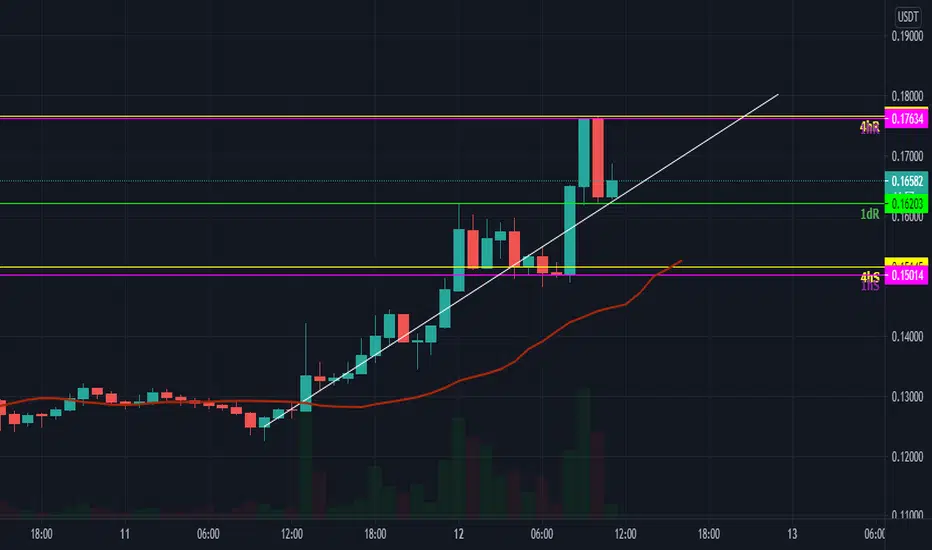
Zilliqa is looking good because it broke a symmetrical triangle this morning, it has got a nice volume because of the news that they are launching something "pretty cool". Watch the latest tweets to stay updated @Zilliqa on twitter. It's also consolidating on an important #Fibonacci level right now with a strong support at 0.14. And don't forget about the MAC-D that is almost getting bullish on the 4H Chart. Will this be another "Sell the news" thing or is #Zilliqa ready to explode? 🚀🪙
Wait for a possible pullback and retest on +/- 0.14 before you enter.
What do you think or see? Please let me know in a comment, would love to see this shared or just push that like button if you agree.
I would appreciate any feedback a like or a simple follow to get you up to date.
"Advise"
- Try to open your entry if the price will show it according to your OWN strategy.
- Don't forget your SL
- It's also important to keep an eye on #BTC at the moment
*Remember: This is just an Idea, no financial advise!
If you're not in cryptos for long term you're probably going to lose almost all of the money invested. Respect the market or the market will rekt you
🚀🪙 -Be fearful when others are greedy, be greedy when others are fearful.
✅ Thanks for reading
#BTC #BITCOIN #ZILLIQA #ZILUSD #ZILUSDT
Zilliqa

It's Time to Buy Zilliqa 62% soon 🔥 ZIlliqa Break Resistance around 0.15 and retest 6 Time So now it's time to bull run next Target is 0.23 🔥
Please don't forget support us : Like , coment , Follow


#ZIL ZILLIQA , New Catalysts IncomingZILLIQA $ZIL, an interesting project overshadowed by ETH this year, will it catch it up? I'm betting so, bull flag and possible upside trend start for 2021.
www.zilliqa.com

ZILLQA #Zilliqa : ABCD to $0.23 Cents for GodZilliqaABCD Pattern, equal AB / CD legs taking Zilliqa to All Time High (ATH)


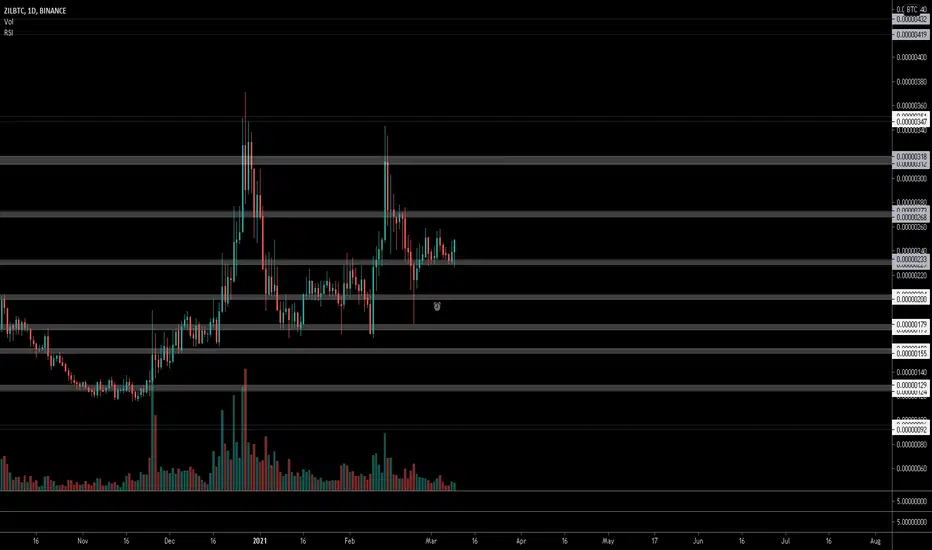
Zil is ready for a 300% move upZil BTC pairs is too strong.
Also, As per wave theory, we are going to start an impulse wave 3, Bags are packed for Zil.
All indicators is bullish also USD pair is bullish.

ZIL usdt - tight 4 & 1 hour resistance levelsIf Zilliqa can break the resistance levels it'll go on to the 18c mark.
Good EMA to support uptrend.
$ZIL, Showing some signs of accumulation above ~230 sats$ZIL
Showing some signs of accumulation above ~230 sats
For now UCTS remains quiet on the 1D & volume is not doing much but worth setting some alerts just in case it catches up..
Usually movements on asset are quite vertical once it starts
Will update if I see changes👍
#ZIL

Zilliqa bulish 🔥Hi Guys,
Best opportunity for best profite. Zilliqa it was in accumulation since 13 feb. so Now is near to break support. the cycle of Zilliqa when break support next Target is 56% equal 0.23$

ZILUSDT One hour wave countHello traders, here is my wave count for ZILUSDT, for the intraday traders. Buy and sell targets on the chart. Good luck!

Spike to $0.18 USD then falls back.by before $0.15 or forget it. Big risk of a dump coming right before $0.18

$ZIL is next after VechainZilliqa following VET chart
Different coins take charge at various stages. Money will flow into coins that are lagging eventually. Currently ZIL is following a similar pattern to VET.
Zilliqa is the world's first public blockchain built entirely on a sharded architecture. Sharding is a database separating technique that allows scaling.
Market cap of 1.4Bn and fully diluted market cap of $2.7Bn with a ranking of #55. Deserves to be in the top 25 atleast.
Circulating supply of 11bn and max supply of 21Bn(just like BTC)
+Strong fundamentals--> Addresses scalability, security and decentralisation
+Great staking rewards--> gets rewarded governance tokens gZIL on moonlet
+Fastest TPS among ADA,BTC,LTC
+ Updates = PolyNetwork Bridge Live (ETH bridge) expect price volatility 1-2 days before the event
+ Github --> Regular updates
+ Team = Well known engineers, academics and entrepreneurs

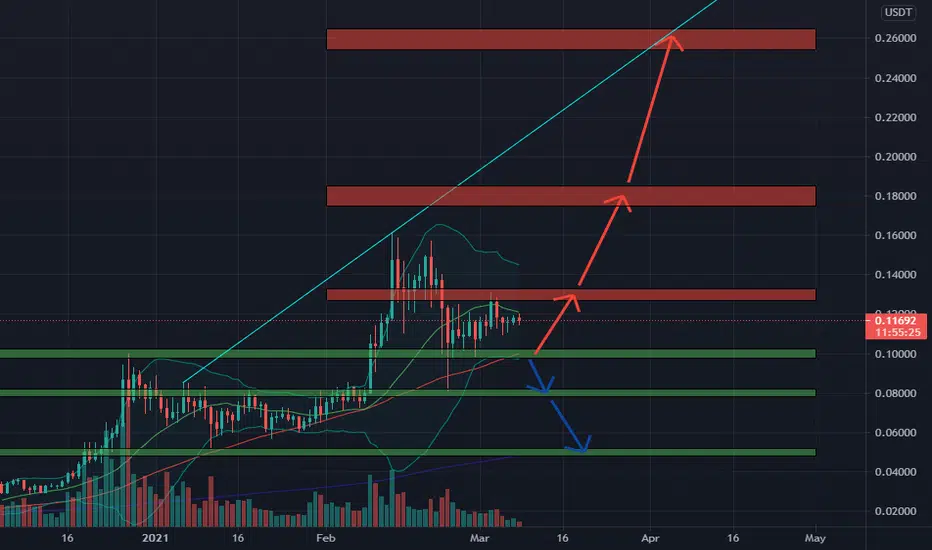
🆓Zilliqa/USDT Analysis (8/3) #ZIL $ZILZIL is on the way to retest the 0.1$ zone and I think there is a buying force at that zone to push ZIL up to conquer the 0.13$ and move up to 0.18$ zone and even 0.26$ zone
📅EVENTS
👉Mar 31 : PolyNetwork Bridge Live
📈BUY
-Buy: 0.0975-0.1025$ if A. SL if B
-Buy: 0.127-0.133$ if A
📉SELL
-Sell: 0.175-0.185$. SL if A
-Sell: 0.255-0.265$. SL if A
♻️BACK-UP
-Sell: 0.0975-0.1025$ if B. SL if A
-Buy: 0.078-0.082$. SL if B
-Sell: 0.078-0.082$ if B. SL if A
-Buy: 0.048-0.052$. SL if B
❓Details
Condition A : "If 1D candle closes ABOVE this zone"
Condition B : "If 1D candle closes BELOW this zone"
Zilliqa Bullish Trade Idea - Load up!I'm bullish on Zilliqa, Green Area is most likely the last chance to buy before we make an other leg up! Load up Now :-)

If it breaks out, an easy 4% ROIIf it breaks out the resistance you can make a 4% Return on investment guaranteed and it's pretty safe. Zilliqa has been in these zones for a long period of time now and I can't see it changing.

#ZIL #ZILLIQA Possible targets for 2021#ZIL #ZILLIQA Possible targets for 2021
TARGET1: 0.32$
TARGET2: 0.90 $
TARGET3: 3.8 $
TARGET4: 12 $
STOP LOSS: UNDER 0.045 $

Zilliqa Weekly ChartZil weekly view. It's on a strong uptrend and the Elliott wave count seems like the third wave has been completed. It's going to make wave 4 and then a leg up to form the final wave 5 in my opinion.

Zil ready for a big move
MACD is changing momentum
Line of resistance and 20MA is about to get crossed
Glory to us HODL'ers!

ZIL
If resistance line 1 is broken, it enters hard resistance 2.
If the resistance line 2 is not broken, it will enter the sideway market.
Please don't trade with this analysis. This is just an idea

Zil - your portfolio is incomplete without ZilZIL is super bullish and this will be super quick and profitable trade.

Possible bearish pennant on the ZIL/USDT 4h chart Can lead to a further breakdown and retest of the 0.09 / 0.075 area.
