ZK/USDT — Testing Long-Term Downtrend: Breakout or Rejection at?Summary
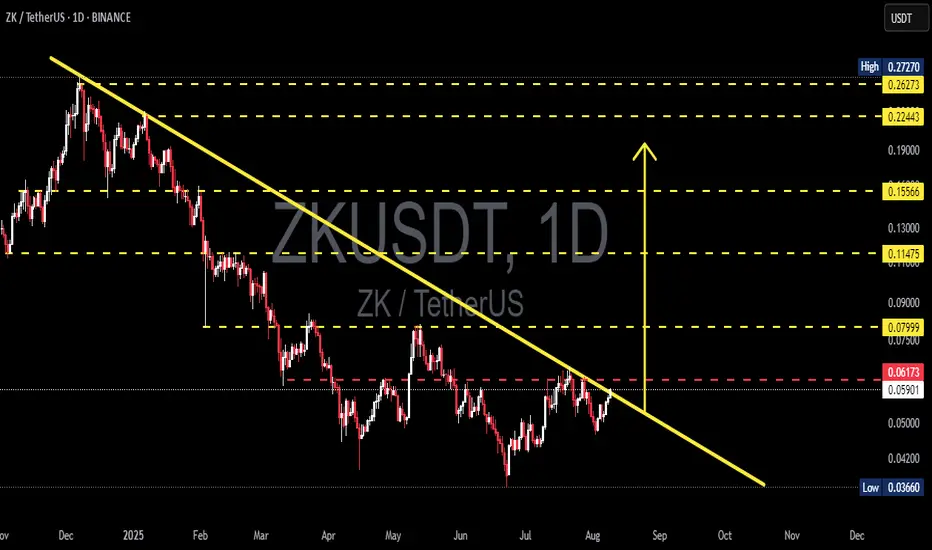
The daily chart shows a clear long-term downtrend from the previous highs — the descending trendline (yellow) has been capping price action, forming a sequence of lower highs and lower lows. Currently, price is hovering around 0.0591 USDT, testing both the trendline resistance and a key horizontal resistance at ~0.06173 (red dashed). Since the low at ~0.0366 (June), the market has been slowly forming higher lows, suggesting potential accumulation, but the main downtrend structure is still intact until a confirmed breakout occurs.
---
Pattern Overview
Descending trendline (yellow) = downtrend structure remains valid until a daily close above it.
Accumulation signs from the 0.0366 low → forming several higher lows.
Key resistance: 0.06173 (decision zone).
Next resistances (yellow dashed): 0.07999 → 0.11475 → 0.15566 → 0.22443 → 0.26273 → 0.27270.
Key support: ~0.042 (intermediate) → structural low at 0.03660.
---
Bullish Scenario (confirmation needed)
1. Breakout confirmation: A daily close above the descending trendline and above 0.0617 with stronger-than-average volume.
2. Post-breakout behavior: Potential retest of the broken trendline as support — a conservative entry point.
3. Upside targets:
Target 1: 0.07999 (~+29% from 0.06173; ~+35% from current price 0.05907)
Target 2: 0.11475 (~+86% from 0.06173)
Extended targets: 0.15566 → 0.22443 → 0.26273 → 0.27270
4. Risk management: Initial stop-loss under retest zone or, for aggressive entries, just below breakout candle’s low.
---
Bearish Scenario (rejection/failure)
1. Rejection at 0.0617 / trendline: If price fails to break and closes bearish with upper wicks, a pullback toward support is likely.
2. Support watch: ~0.042 (intermediate) → 0.03660 (structural low).
Downside from 0.0617: ~−29% to 0.042, ~−38% to 0.0366.
3. Further risk: A daily close below 0.0366 could trigger continuation of the major downtrend.
---
Key Levels (Quick View)
Current: 0.05907
Breakout trigger: 0.06173
Targets: 0.07999, 0.11475, 0.15566, 0.22443, 0.26273, 0.27270
Supports: ~0.042 → 0.03660
#ZK #ZKUSDT #Crypto #Altcoin #TechnicalAnalysis #TA #Trendline #Breakout #PriceAction
Zk
#ZK/USDT Trendline Break #ZK
The price is moving within an ascending channel on the 1-hour frame, adhering well to it, and is poised to break it strongly upwards and retest it.
We have support from the lower boundary of the ascending channel, at 0.05688.
We have a downtrend on the RSI indicator that is about to break and retest, supporting the upward move.
There is a key support area (in green) at 0.05628, which represents a strong basis for the upward move.
Don't forget one simple thing: ease and capital.
When you reach the first target, save some money and then change your stop-loss order to an entry order.
For inquiries, please leave a comment.
We have a trend of stability above the Moving Average 100.
Entry price: 0.05665
First target: 0.05866
Second target: 0.5982
Third target: 0.06144
Don't forget one simple thing: ease and capital.
When you reach the first target, save some money and then change your stop-loss order to an entry order.
For inquiries, please leave a comment.
Thank you.

ZK - Golden opportunity? 0.40? Hello everyone, here’s my new analysis on ZK.
Recently, the price surged nearly 80%, followed by an 18% pullback over the last two days. From its all-time high, ZK is currently down about 80%, which in my opinion presents a golden opportunity.
Based on my research, the peaks of altseasons often occur between December–January or April–May. After analyzing the Others Market Cap dominance chart, I believe we’re setting up for a strong altseason in the next 5 months. Over the last few years, BTC has significantly outperformed altcoins—but recently, I’ve noticed a major shift in market dynamics, indicating that capital might be rotating back into alts.
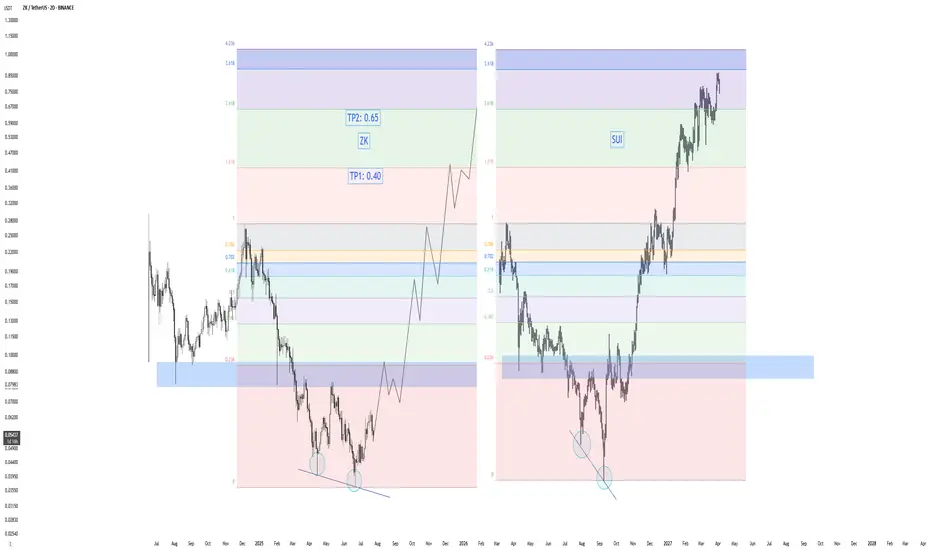
On the chart, ZK is showing a classic crypto crash-recovery pattern. For example, SUI dropped around 80–85% before rallying over 1000% in just 4 months. I see a strong structural similarity between the bottoming pattern of SUI and the current structure of ZK.
If ZK breaks the resistance zone at 0.080–0.095, I expect a rapid move up toward 0.22–0.26. After that, a healthy correction around the previous ATH would be expected—before potentially heading to 0.40 as Take Profit 1 (TP1).
ZKUSDT Elliott Waves analysis📝 Currency NYSE:ZK
✅ Entry points for the currency: at the current price of 0.06135, the reinforcement should be within the range of 0.05321 - 0.04860
🔴 Stop loss is below 0.03660
💹 Potential targets: first target 0.08140 and if the currency enters a bullish wave, the target will be towards 0.1130, reaching up to 0.150
📊 The profit-to-loss ratio is 5:1
📝 This idea is based on Elliott Waves analysis, especially since the beginning of the currency's listing, where a WXY pattern formed, and this pattern was confirmed after the upward rebound from 0.03660, which we considered as our stop loss. The liquidity range is the range we defined for reinforcement; its stability will give momentum and strength to the currency to complete an upward path, at least achieving a trend towards the peak of wave 4
❤️ Good luck to everyone - do not enter any currency before studying the risk ratio you will undertake

zkSynch · 988% in the Coming Months · 2025 Bull MarketHere is another pair that is safely trading above EMA55. Notice that after this level was initially conquered 10-July what followed was a retest. Two red candles pushed prices lower and the level held as support. With this, EMA55 is now confirmed and zkSync can easily grow. Mid-term.
When the trading goes above EMA89 we say the long-term bias is active, and only when the close happens above the next EMA (or MA) we can say the long-term bias is confirmed. Just some technicalities but please, follow me.
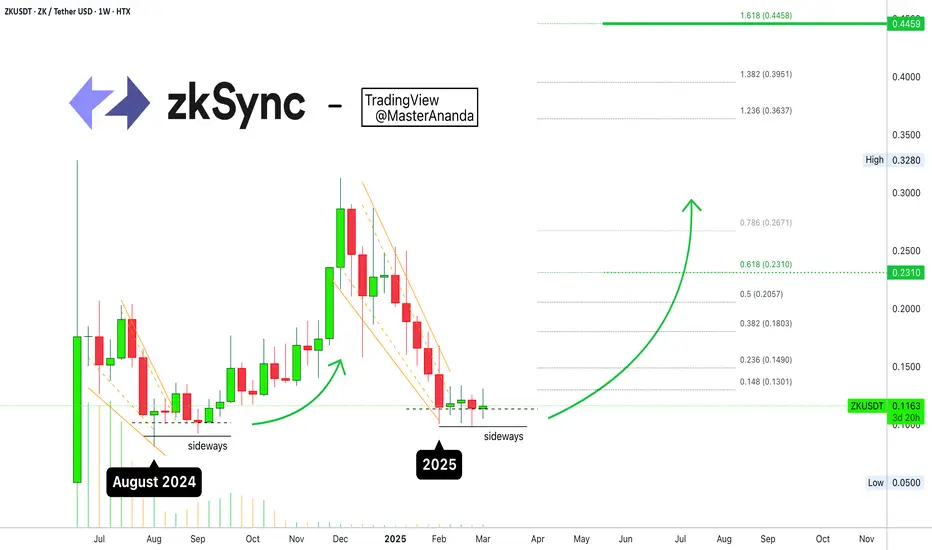
We can theorize about the bottom low, the correction & retrace or, we can go straight to just what you want to know. Let me guess... How far up can ZKUSDT (zkSynch) go? Right? Of course!
The new all-time high targets, conservative targets, sit at $0.41 (598%) and $0.65 (988%). There is an easy target before reaching a new ath at $0.18 for 208%. You can use this one if you like to trade more based on the short-term but if you want higher profits you need to aim higher. You have to wait.
The wait is not long because bullish action is already on. It is already happening and will continue to happen; growth will intensify; momentum will grow. Market hype, prices shine, aiming high, ride the ride of your life to a new all-time high.
The timing is right you can't go wrong. There is nothing better than buying today and tomorrow seeing your portfolio 100% up, that's only the start. Expect 20-30X grow by the time the bull market is set and done.
2 months only? I don't think so. Crypto is set to grow long-term.
Plan now, prepare now and reap the reward. Persistence, perseverance and consistency pay. Work hard and smart. Do you what you want. You are blessed and you deserve the best.
Namaste.

$ZKUSDT Trade Setup 1D ChartBINANCE:ZKUSDT Trade Setup
Entry: CMP
TP 1: $0.07027
TP 2: $0.8028
TP 3: $0.10841
TP 4: $0.12670
SL:- 0.04774
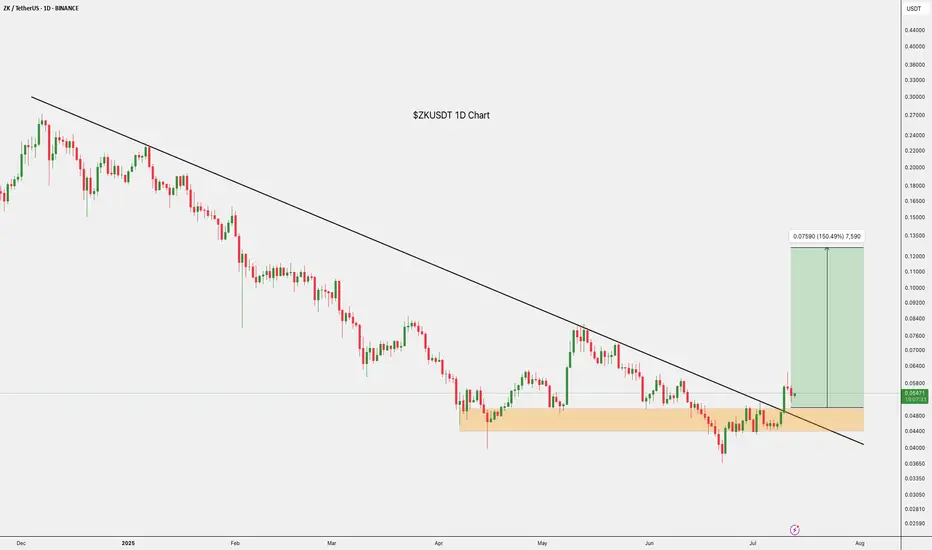
Breakout confirmed.
Hold above the trendline with a bullish bias.
DYOR, NFA
ZKUSDT 2D AnalysisZK ~ 2D Analysis
#ZK This trade is very risky, buy if you still have confidence in this coin with a short term target of at least 15%+ from here.

ZKUSDT 1D AnalysisZK ~ 1D Analysis
#ZK Buy incrementally on retest of this support block with short term target of at least 15%+ from here and long term target of $0.2727

ZK Aanalysis (12H)After forming a 3D bottom, the price moved upward with a strong and rapid bullish wave that was stronger than the previous bullish waves within the bearish move, reclaiming a key zone. Additionally, an important trigger line has been broken, which strengthens the bullish outlook on ZK.
We are looking for buy/long positions within the green zone toward the targets. The targets are marked on the chart.
A daily candle closing below the invalidation level will invalidate this analysis.
For risk management, please don't forget stop loss and capital management
Comment if you have any questions
Thank You

ZK Secondary trend.-82% Wedge. Reversal zones. 01 05 2025Logarithm. Time frame 3 days. Decrease from listing about -82%. For cryptocurrencies of such liquidity and capitalization, this is not the maximum decrease (-90-96%). But sometimes from such values as now (-82-85%), taking into account the news hype during the listing "whales $ 458 million", a reversal and strong pumping can occur under the market as a whole. For example, like another hype project of "hanging noodles" - Flare (distributed to XRP holders). Decrease by -82% and then pumping slightly above the listing price under the next alt season of the cycle + 560%.
This does not necessarily mean that this will happen, this is an example of what happens from such values of decline with such liquidity and hype. In some ways, not only in the structure of the TA formation, but in the hype and disappointment of "investors", the projects are identical.
Main trend , and the previously shown zone, in which the price is now.
ZkSync Main trend. L2 for ETH. $458 million funds 21 02 2025
Main trend now in the moment (full trading history).
There is no need to guess the minimums and maximums. It is important to know these zones and have an acceptable average price, from the position of the trend and its potential. It is regulated by the distributed entry volume (in advance) at potential reversal zones.

ZKUSDT 2D AnalysisZK ~ 2D Analysis
#ZK Buy back from here with a short -term target of at least 15%+ from here.

ZkSync Main Trend. L2 for ETH. $458 million funds 21 02 2025Logarithm. Time frame 3 days.
🟢Reversal zone. At the moment, there is a fractal repetition with the previous reversal zone. The logic and key local levels on which the direction of the secondary trend will depend are shown with arrows.
🔴Also showed the range and future levels of an unlikely extremely negative scenario. That is, a breakthrough of the long stop collection zone of a large squeeze (this happens very rarely, since it is irrational, but since in the news background earlier during the listing - funds of 458 million investments, then why not) and the formation of a capitulation channel under the channel with a full range (hold the chart and pull it down), or only from its median (dotted, more likely if we go this way).
Also, regardless of the implementation of scenario 1 or 2, the maximums of this cycle are shown (hold the chart and pull it up). Or rather, the zone. The percentage itself will be different, the "levels" of the zone, most likely, will not.

ZKsync: Your Altcoin Choice (S2)ZKsync has been crashing and it keeps on crashing. Yesterday this pair produced the highest bearish volume ever on the daily timeframe and the highest since August 2024. This is likely the bottom.
The volume bar yesterday is just too big, it is completely out of proportion with the other bars. The last time this happened ZKUSDT started to grow. Believe it or not. I will take this as a bullish reversal signal.
A new All-Time Low. Bears are done, or could be done. This is a good entry point because of how the market behaved in the past. This is a potential bottom catch.
The main target here on this chart has a nice 787% potential for growth. This can be achieved soon, within a short six months. Huge potential for profits to be honest and the low is very risk. Since the pair is trading at bottom prices, it can't go much lower, the Altcoins market is already starting to turn. What one does, is exactly what the rest does as well.
Thank you for reading.
You can enter now, full force. Go ahead!
Namaste.

Trading opportunity for ZKUSDTBased on technical factors there is a Buy position in :
📊 ZKUSDT
🔵 Buy Now
🪫Stop loss 0.0635
🔋Target 0.0888
📏 R/R 2
💸RISK : 1%
We hope it is profitable for you ❤️
Please support our activity with your likes👍 and comments📝

ZKUSDT 2DZK ~ 2D Analysis
#ZK Buy gradually on this support block, if you still have a Conviction on this coin with a short -term target of at least 15%+.

#ZK/USDT#ZK
The price is moving in a descending channel on the 1-hour frame and is adhering to it well and is heading to break it upwards strongly and retest it
We have a bounce from the lower limit of the descending channel, this support is at a price of 0.0676
We have a downtrend on the RSI indicator that is about to break and retest, which supports the rise
We have a trend to stabilize above the moving average 100
Entry price 0.0729
First target 0.0792
Second target 0.0838
Third target 0.0896

zkSync Hits Bottom: Trading Basics & Bull-Market TheoryFour weeks sideways after a major flush? This type of action gives it all away. It gives away the fact that the market is no longer bearish because the action changed from straight down to null, sideways. It is likely to change from sideways to up.
Look back to August 2024, it is the same all over again. Watch. zkSynch (ZKUSDT) went down, stopped falling to move sideways for several weeks. This was followed by a strong bullish wave.
We have the drop in 2025 and the sideways action, what follows?
Bitcoin is going up, the Altcoins will do the same.
The same volume signal is present here as well, the one we saw on the LayerZero chart. While bearish and neutral action is happening, trading volume is really low. This means that no real participants are present, the chart is being drawn by trading bots. Just watch. When prices start to go up, volume will go up as well. This is the signal that people are buying, and only now the price is great.
Buy at support. Buy at the bottom. Buy when red. Buy when prices are low.
Accumulation at support and then hold.
When the market is green, hype, high and up; that's the time to consider taking profits because the bull-market ends at the top. A bull-market starts at the bottom, that's when the market is bullish, when prices hit bottom and the oscillators start to read oversold. Oversold oscillators, bottom prices and positive news show up. These are the early signals pointing to a market reversal and change of trend. This what we call bullish and we are bullish now. Here we just need the initial bullish breakout for confirmation and the bulls are in.
When the oscillators hit overbought, everything is green and the market is hitting new All-Time Highs but negative news start to show up, this is a sign of overheating and surely what follows is a long-term drop. That's why I say the best time to buy is when prices are low. Sorry if this is too basic, but we start from scratch and get into the complexity as the bull-market develops.
First we buy and hold. Later we will consider different trading strategies, leveraged trading and so on. But first, spot trading, zero risk and a high potential for rewards.
Namaste.
zkSync Fresh L2 coin for ETH. 458 million $ investment by fundsLogarithm. Time frame 1 day. Since the coin is fresh (people sell freebies), and it was recently listed, if the market will be dominated by a downtrend until October, a downtrend channel will be formed in case of a break of the key support.
_____________________________________
Most importantly:
1️⃣ There was aerdrop manipulation , the community got a very small % of the promised coins, which is in the hands of developers and crypto funds (after shaking out now, there will be full control over the price).
2️⃣ It is worth noting that crypto funds “invested” (with speculative interest) 458 million dollars in the asset. Which is an absolute record.
The first and second are extremely positive for the maximum prices of the asset in the cycle in the future. Consequently, the asset is interesting for investment and position trading, and it does not matter what will happen now locally for a couple of months. Work from the average buy/sell price.
____________________________________
The chart shows the key resistance levels for the first significant pumping after the trend break, as well as the maximum distribution zone targets of this cycle.
The price potential will be “unlocked” similarly naturally not now, but when the solution will be implemented, there will be media PR, smart money will partially “exit” from the asset. The potential is naturally great, it is shown, who is attentive.
Let me remind you, L2 is a solution for scaling the ETH network. When this is implemented and PR'd and ETH is in its first distribution zone, then pump in similar small capitalization assets.
__________________________________
Work from the average price of purchases , so in the future sales and no minimums and maximums (even if you are sure that you know and understand how “exactly” it will be, I note that most people who do everything by reverse think so), as this is the fate of true hamsters. At the same time, you need to understand the zones where it is cheap and where it is expensive, and what the general trend in the market is developing.
⏰ Profit from the local game (not necessarily to work this way) is not big (you “spin the volume” part of the allocated money to a certain zone of the asset - work). But, such local work gives you to overcome fear, because you always have money to increase coins.
⚠️ Do not abuse stop loss , where it is not necessary, because everything will be taken away on the “flat place”.
⚠️ Prefer spot trading , which forgives elementary mistakes, if you are not a very good trader. With margin and futures, your risk must be justified. If you are a ludomaniac (most sick people won't admit it, maybe you are one/one of them) then leave this high risk trading.
🐹 Psychology . If, you feel that you, like everyone else, will do, when not necessary under psychological pressure and news some not logical bullshit, it is better not to trade at all, and invest. “Hold” coins for a couple months, dividing the amount of the entry into 2-3 parts. When the market is distributed, you will sell with a big profit. Maximum targets (not necessarily, as depends on a lot of factors), is the zone 0,6 - 1 dollar.

ZK Updaterode this one back to the entry (even after the trendline from 5th Aug was broken)
in-detailed explanation in the USDT.D chart (give it a read if you want to find out how to spot strong reversal areas)
I've explained in detail what I'm expecting in this year. Please refer to the previous posts for in-depth analysis and thoughts. Too tired to write anything now :)
TLDR for the lazy ones: Late Feb-April, I'm expecting a massive rally. 100% loaded here personally!

ZKUSDT 1DZK ~ 1D Analysis
#ZK This is the lowest support for now, Maybe you can consider this support to start buying back from here.

ZKIt is currently playing in these two areas. If it wants to break the red box, depending on market conditions, it can go to the orange areas, and if it can't, the first stage is the two green lines and the designated support.

BUY ZKhello friends
This token has given a good profit with the increase in price, now with the correction of the price, we have a good opportunity to buy step by step and move with it to the specified goals with capital management.
*Trade safely with us*

ZK LongThe ZKUSDT pair is currently in an accumulation phase as it approaches a key support zone, marked as the "Accumulation" area. This phase suggests a potential buildup of buying pressure, which could lead to a significant price movement upwards in the near term.
Trade Entry: Consider entering a long position near the current support level of 0.1512, which aligns with previous lows. The price action in this zone indicates a high probability of reversal, marking an optimal entry for an upward move.
Target Area: The target for this trade is towards the PMH (Previous Market High) at 0.5003, which represents a strong resistance zone. We anticipate a possible push to this level as the price continues its recovery.
Risk Management : Keep a tight stop loss around the PML (Previous Market Low) at 0.1116. This level offers a solid risk-reward ratio, as a breach below this point would signal a potential trend reversal or further downside.
Trade Duration: This trade is expected to play out over the next few weeks, with significant price movement likely from February to April 2025.
Strategy: This is a momentum-based trade following the accumulation phase, with the expectation of a price breakout. The market conditions suggest a shift from a consolidation phase into an upward trend, providing an attractive long setup.
