GBPUSD (1Hour)So after doing some studying and learning a couple of things this is my outlook on how this market will flow today. Going to keep an on on this pair. Happy trading week :)
Zones

How to Use Manual Levels PlotterBy defining a Structure of the Market you are trading, you can utilize the scaffolding of price as a means to take Low Risk Trades with High Rewards. Take this example of the ES. Levels were drawn beforehand on a larger TF chart. I define the structure of the market as places where either 1. Buyers Beat Sellers, and price shoots up, or 2. Sellers Beat Buyers, and price shoots down. It is at these points of control where price tends to revisit. By analyzing the price action on lower TF charts, we can take minimum 1:3 RR trades as price crosses over these levels. My indicator () makes it a bit easier to keep track of the levels for each instrument you're trading, whether you're on the computer or mobile. By observing Price Action on lower timeframes, we can analyze the trend and strength of the market to take a trade with a predetermined target(the next level above or below) and a predefined risk of 1/3 the profit target.


watch my zones and learn! unbelievably accurate lol BTCI'm waiting for a clear signal to long or short this, not trying to rush into something, unclear where we're going atm...
Sep 10 - Bitcoin resistance/support levels & buy/sell zonesWe are nearing a breakout moment of a mid/long term bullish triangle/pennant pattern. Keep an eye out for breakouts! Previous highs (both strong and weak ones) at around 11k, 11k3, 12k4, 13k, 13k2 and 13k9 need to be broken for the potential of longer term bullish moves.
Historically, however, bitcoin has had a tendency to break towards the downside from such patterns, like how we went down from the 6k levels to 3k levels. Hence, we could very well see downward moves toward 9k and 7k regions and in probably the worst case 6k regions in Nov 2018.
There seems to be more room and towards the upside though. Also, fundamentally, with ETFs starting to take root, bitcoin dominance being strong and being a potential hedge for an upcoming economic recession, are all bullish signs. RSI shows a bearish divergence, making a case for upwards movement as well.


EUR/USD 1 hour entry with close below lowEarlier today I published analysis on the daily chart for this pair. After looking into it, I may enter on the 1 hour if there's a close below the 1.1016 area (dashed line), and try to ride it down to the green demand zone. Once it gets to the recent low area, I will start to really watch it and tighten my SL, as it could reverse in here as well ... You never know!

exactly as I said the day before yesterday... btc price actionThe mentioned price move happened to the down side, next zone holds atm, I think we could still go lower... watching this zone for a clear trading signal

What happens next?? Bitcoin Price AnalysisBitcoin has been ranging for quite some time now... I'm guessing either we will keep ranging for some more days/weeks or we will see a big move in the coming days. Maybe some catalyst news for a big boost up or a dump like in november?

XAUUSD waiting for setup on breakouts.Projection for FOREXCOM:XAUUSD (GOLD) which will provide two potential setups on breakouts on either sides.


Bitcoin perfect price action! My zones are incredible lolBitcoin is moving from zone to one, it's crazy how accurate simple price action is! Let's see whether it manages to close above the 0.5 EQ for a bullish scenario...
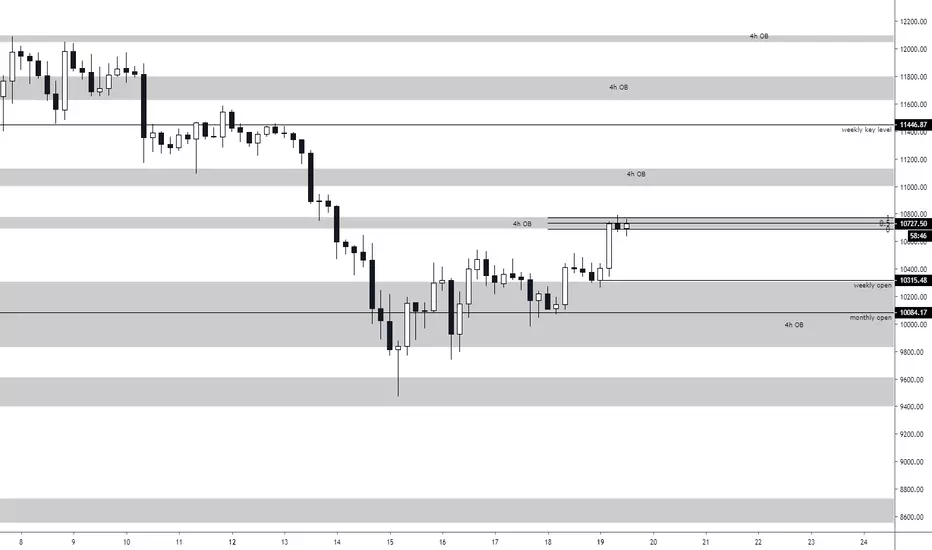
Bitcoin - 4h close above the block is bullishIf bitcoin closes its nxt 4h candle above this 4h OB, that would be a bullish scenario. 30 minutes left, long it or wait for the retest! if we dont close above (whole candle) I would wait for a potential short scenario.

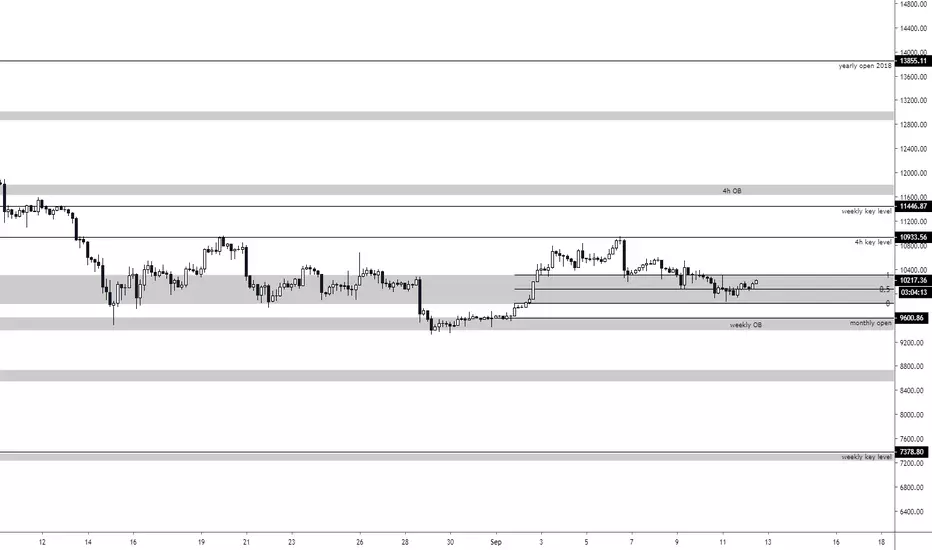
Bitcoin - something is about to happen...Still below my weekly key level, also below the weekly open... I feel like a lot of people would expect a move to the downside seeing this chart. maybe the exact opposite will happen? I'm guessing it will be a big move up or down, too risky to trade imo, I will just sit this one out and try to catch the pullback...

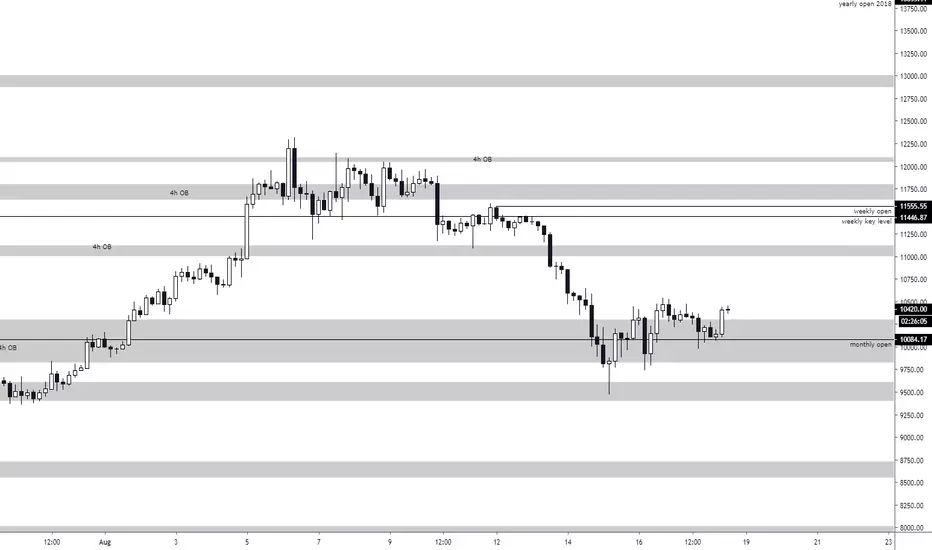
Bitcoin Price Analysis July 31 2019Rejection at the 0.5 EQ of the 4h OB, looks short term bearish to me, looking at a retest of the lower OB.

The bearish cases for bitcoin-which support most likely to hold?Let's try to consider the more bearish case where the 7.5k-8.2k zone is eventually broken and BTC goes down to test lower previous support zones, which support area do you think is most likely to hold as the real bottom?
I really don't feel sure about what zone is most likely to hold, but f I had to gamble I would probably put most of my money on the 6k zone, the 5.5k zone and the 3.5k zone.
Which zone most likely to be the bottom?
what chance do you think BTC has of breaking the previous 3k low?
Cast your votes in the comments down below!
(srsly do it i'm interested)

USDCHF short idea FOCUSEDFORTUNEFXProviding the way price is acting around this area of confluence, it suggests we should see rejction here, followed by a continuation to the downside, where we will either meet the previous falling wedge trendline and bounce. Or continue with a clean break and retest to trade back within the wedge.

BNB Fibonacci harmony levelsBokchoininja here charting some fibonacci levels for u guys check out the buy zone on the 0.618 level that looks very attractive.


CHFJPY - 150 + potential movePrice has been very corrective as of late and has reached a supply zone.

EURUSD Trendline and zone supportGrabbing my attention on EURUSD currently is this resistance zone from previous daily pushes, recently we broke through yet we are now seeing a potential retest. You may of also clocked the retest of the trendline. Awaiting the closure of todays daily candle before looking to take any substantial moves. To confirm any trades on this pair I'll be looking for any of the following three things; consolidation, spinning top candles, engulfing candles, substantial pinbars, an ema cross and as an added confluence I will be watching DXY to see strength or weakness through the dollar!
