XAUUSD Overview (19-Jan)PEPPERSTONE:XAUUSD XAUUSD turned upwards from 1940.
Watch 2040 for opportunities to sell towards Zone 2
Zones

ASTR-2024A promising parachain in the DOT ecosystem
The price came to an imbalance zone of 0.13-0.22
The next zone is 0.56-1.42
The growth potential is 7-9 $
The price of the total volume is 0.0427
The purchase price of 0.035
At the level of 0.14 closed 50% of the pose (body removal)
The rest went into a long-term portfolio!

DASH Purchase!!!DASH has reached the global bottom!!!Purchase zone 18.17-30.23
Purchase level 25.04
The price of the total volume is 77.99
Volume price 27.51

TON-2024Ton is in the FIRST global redistribution in the form of a triangle!
The price of the total volume is 2.281
Everything below is acceptable for purchase for a couple of cycles and more than 5-10 years!!!
I expect an exit at the end of this month!
The first control zone is 5.646-11.140
Level 7.931
Next zone 40.526-147.418
District 69.801-85.589

ARB-2024The global alignment for 2024!
The price goes to the Control ZONE 3.02-4.79
Level 3.81
Correction in this zone (FLAT) or a rollback to the level of 1.91
Further hike to the level of 16.61-19.07
In the global sales area 11.49-27.55
BEAR to the 4.25-1.57 zone!!!
The price of the total volume is 1.1673!!!

$TOTAL - Bitcoin Halving Sparks $10 Trillion Crypto TsunamiThe cryptocurrency market is poised to grow from $1.5 trillion to $10-12 trillion in the next two years.
Key factors
Bitcoin halving in 2024,
Increasing institutional adoption,
Rise of decentralized finance (DeFi),
Integration of blockchain technology across industries,
Global economic uncertainty driving demand for alternative assets,
Ongoing technological advancements making cryptocurrencies more accessible.
These factors collectively contribute to the positive outlook for the cryptocurrency market.
CRYPTOCAP:TOTAL
CRYPTOCAP:TOTAL2
BINANCE:BTCUSDT
BINANCE:ETHUSDT
! Not an advice - DYOR !

DFCGlobal purchase zone 0.1245-0.0670
The level is 0.1024
Locally, it wants to be above 0.155-0.0914
The level is 0.1148
The price of the total volume is 0.2195
Sellers do not put pressure on the market, distribution is proceeding cautiously!

UWGN is in the Global Purchase Zone!!!The price has arrived and is in the Global Purchase ZONE of 37.0-18.8
Global purchase level 27.9
Left the local area 24.8-13.6
Local purchase level 20.5
The purchase level according to the backup scheme is 22.3
The volume price is 25.9 !!!
All levels have worked out !!!

BTC is in an Imbalance Zone!!!Bitcoin has entered the Global Zone of Control (imbalance) 42690-59175
Local area 45070-54547
Level 1) 49038
2) 49320
Purchase Levels 15652.1
15732.0
Volume price 19199.2

FLOW has left the zone!!!The price formed a triangle in the control zone of 0.607-0.704,
and after the breakdown left the GLOBAL ACCUMULATION ZONE!
The Next Control Zone Is 0.931-1.233
My Control zones, some traders call them imbalance zones!!!

TRX is coming to unload!!!The redistribution of the coin occurred in the Control ZONE 0.0458-0.0870
The average volume price is 0.656
We are going to unload in the ZONE 0.293-0.989
To the level of 0.489

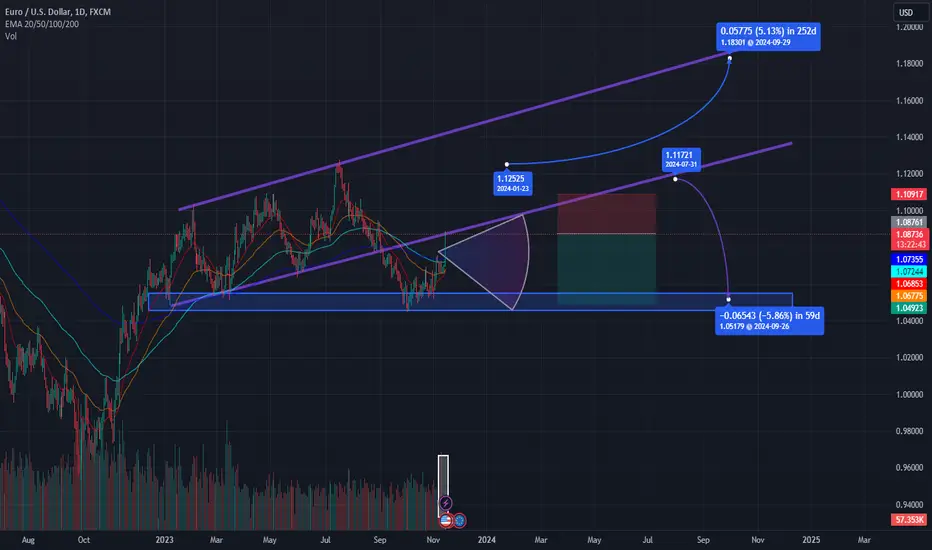
Analyzing Potential EUR Movements: Channel Pattern SVM OverviewD ear Esteemed TradingView Community,
I trust this idea finds you well. In the intricate world of trading, where decisions are often rooted in data and analysis, I'd like to share my recent findings regarding the EURUSD market. Please note that this is not financial advice but rather a reflection of my analytical perspective.
In October, my focus zeroed in on a noteworthy development in the EUR market: the emergence of a demand zone around the $1.05 level. Leveraging advanced tools like AI and Kernel SVMs, I identified this zone as pivotal support, opening the door to intriguing possibilities for both short and long positions.
The demand zone, acting as a robust support, fueled a successful long trade as the price reached the projected target. However, the current scenario introduces the prospect of a short position, with potential entry points highlighted by the bottom purple line, a resistance level identified by SVMs.
As we navigate the intricate dance between support and resistance, it's crucial to acknowledge the uncertainty inherent in market dynamics. The potential breakout from the resistance is not guaranteed, and the price might trace its steps back, especially if it encounters resistance at the identified purple line. In the event of a reversal, the previous long entry point (demand zone) could serve as a short target.
Bearish scenarios envision the price consolidating below the resistance, possibly entering a downtrend. Yet, the journey to the demand zone may not be immediate, as additional chart patterns could manifest between the resistance and the demand zone, either reinforcing or challenging the short thesis.
A significant surge in sell volume on 13-14 November raises the probability of a bearish scenario. This surge, aligned with the preceding rally, suggests a potential exit strategy for investors capitalizing on heightened market activity. The existence of a parallel resistance trendline, derived from historical peaks, adds another layer of complexity to the analysis.
While indications of a breakout are not definitive, the possibility of the price returning to the rising channel between trendlines cannot be dismissed, especially considering the impact of unforeseen news events. Though technically less probable, the practice of markets often defies technical norms.
In conclusion, I've marked this analysis as 'short,' considering the potential bearish patterns associated with rising channels. However, it's essential to approach these insights with a discerning eye, recognizing the dynamic nature of financial markets. Your attention to these nuances is greatly appreciated.
Kind Regards,
Ely
ACA in the Global Buy ZONEThe price is in the Global Buy zone 0.0732-0.0226
Local purchase zone 0.0457-0.0230
The purchase level is 0.0363
The way out of the triangle is Vague!!! Is it possible to return to the Local ZONE ???
The price of the total volume is 0.0491
Potential for the future-$43
The DOT ecosystem is developing!

Flow in the accumulation zone!!!The price is still in the Global accumulation zone, as soon as it leaves it beyond the level of 0.703 with consolidation, this will mean the beginning of global growth of the asset!!!
The purchase levels under the "Impulse" strategy were:
Global 0.413
Local 0.410
Buy zone 0.497-0.348, level 0.416
I don't see the strength yet! it is possible to return to the zones: Local 0.560-0.311 and Purchases 0.497-0.348!
The price of the total volume is 0.445 - for those who do not remember, or do not know!
This is the average price of the largest traded volume, and since the price is at the bottom, it is (the average price of the accumulated position at the moment)
Good hunting to all!!!

Clean traffic downAs Gold heads down lower. We are looking for a clean range of motion to the downside. The Gold candle closed below the 1978.75 area with the candle confirming that there is more volume to the downside. Following this range. It's looking to be clean traffic going all the way down to the low of the candles bearish rejection wick at 1969.77. Price may struggle to break lower than this area but we will need another confirmation on candle close before we can verify anything to be more confident. I will be at a safe entry at the new 30m candle open at 1977.55 doing a safe scalp until 1975. The more aggressive traders can target 1970

XRP.USD (Ripple) Full AnalysisHello My Friends.
It's a new day and I want to talk about my favorite Coin known it as Ripple.
It's really a die-hard asset against many problems.
Let me remember that it's NOT financial advice.
It's just a new vision for the Ripple.
So, please read carefully and don’t forget to Like, share write your friends, and write your comments below.
Let's go into details.
As you see, I want to analyze this chart on a weekly time frame to show you what's happening in XRP on a big scale!
I drew 5 zones as the main support zone. I believe that the First zone around 0.45 USD will be lost soon.
So, don’t hurry to buy this asset at an insensible price.
The Next support is around 0.28 USD. This zone is rarely strong but I believe that this zone will be broken too.
The 3rd one is around 0.18 USD and could be a good place to put your order for the first Level.
But I believe that the 0.15 USD will touch the Price and it's really an excellent place to buy XRP.
Finally, the Last support zone is around 0.12 USD. This is a fabulous zone to buy and hold Ripple for a Long time.
I want to tell you something sweet, according to my calculation, the final target of Ripple at the end of the next Bull cycle will be around 50 USD in the long term. it means a profit of more than 40000% at the end of 2029. So, please pay attention to my words and be patient.
The situation of the world economy is terrible.
The U.S. government is stuck in recession. So, it's a good chance to start the best investing.
Please be patient. control your emotions.
Opportunities in the market flow smoothly like a river.
It was my duty to tell you all things you need to know.
Please don’t forget to write your comments ✍️✍️ Like 👍👍 and Share 👌👌 this Vision with your friends.
And Tell me do you agree with me or Not?
I wish you Health and Wealth
Sincerely Yours
Ho3ein.mnD

ICP purchase !!!The asset has again entered the buying zone 3.648-2.625
Touched the purchase level of the local zone 2.910
It is below the global purchase level of 3.624
It is below the volume price of 4.229
My pending order 2.910 was triggered
Stop order 2.09

FTM in the purchase zone!!!FTM price is in the global buy zone 0.27-0.12
The purchase level of 0.19 is below the volume price - 0.2407
The price of the total volume is 0.0174
Test: A new purchase level has appeared on the chart! (green dotted line) 0.1831

ACA accumulation level!!!The control zone 0.45-0.25 has been worked out
Now the price is in the buy zone 0.08-0.025
Purchase level 0.048 :)
The price of the total volume of 0.048 Corresponds to the accumulation level!!!
Exit from accumulation to the zone 0.11-0.18 ?
0.03732!!!

OM purchase zone!!!The control zone 0.15-0.089 has been worked out
Now the price is in the buy zone 0.03-0.01
Purchase level 0.01854 :)
Total volume price 0.037


Today's TSLA levels, zones, and tradeplan chart.Enjoy, as always watch NASDAQ:QQQ AMEX:SPY before entries.

BTC is a possible outcome!!!Why do I think so?
According to one version, the growth ended at 68944.62 with the
fifth wave according to Elliott's theory, from the entire movement of Bitcoin since 2010!
The price is lowered to the level of 15495.37, which may be the first wave
Adjusted by 31799.86 (second wave)
And it can give a third wave to the new Global zone 7577.63-3629.76
By making the current Global Zone a zone of Control at the highest TF
According to the second version, the fifth wave ended in December 2017 and was corrected in three waves into a triangle!
Then
From the current control zone we can go to the level of 48191.03
Or give a correction deeper at 22140.02 and from there it will go to the level of 48191.03
And then HIGHER!!!
I will attach a global screen!!!
