Impulses and zones 1I set the grid to the first impulse 69275.47-55114.24
The grid shows us two zones Control zone 34884.50-27753.44
The global buy zone is 17972.86-14968.03, it is in this zone that we close the sell and open a buy
Now we need to narrow down the buy zone. Watch "Impulses and Zones 2"
If you make it on one decanter, you get porridge!
An interesting fact: on the chart of this exchange, the volume price is 19207.35
and on another exchange 16752.88
The difference is 2455.
Zones

FLOW in the buy zone!!!FLOW is in the global buy zone 0.70-0.19
Buy level 0.413
Local buy zone 0.667-0.345
Buy level 0.480
Buy zone 0.497-0.348
Buy level 0.416
Volume price was 0.627
As long as the price is under the volume price in the FLOW buy zones, you can buy !!!

HT in the buy zone !!!HT is in the global buy zone 3.38-1.57
Local buy zone 3.17-1.82
Buy zone 3.4-2.44
Buy Level 2.51
Bucket $1.72 (maybe backache)!
Everything turned out in a heap! I just really wanted to show you where the volume is and what its price is!
The price of the volume was 1.08 Most likely, the som exchange bought a large volume of tokens at this price and is still holding it!!!
It follows that the price should be pushed well above the previous high!!!
And this is at least 14X.

EGLD in the buy zone!!!EGLD is in the global buy zone 55.89-26.85
Local buy zone 37.08-21.06
Buy zone 32.76-25.84
Buy Level 29.10
A bucket of $23 (maybe backache)!
Volume price was 7.78
The one who has accumulated volume at this price is still holding it!!!
It follows that the price should be pushed well above the previous high!!!

BSV in the buy zone!!!BSV is in a global buy green zone 46.371-22.132
Local buy zone 39.588-23.522
Buy Level 30.936
The entire local area is eligible for purchase !!!
The volume price is 170.42 orange.
I don't think that at this level someone gained volume, rather there was a sale!!!

TRADE PATTERNSFIBONACCI LEVELS
How retracement levels works in fibonacci
BULLISH CHART PATTERNS
Identify this type of patterns in live market and take perfect entry & get your profits without loss
Make sure you definitely main the stoploss & trade

BTC ANALYSIS 21/06/23BYBIT:BTCUSDT.P
WE ARE BACK! with yet another but positive BTC analysis. So yes, that 200EMA and that level of support that we were at was a genuine bottom and we have bounced back for an exciting bullish run (remember everything is uncertain, but there's no problem in pushing your perception with confidence). I think we see a sell off around the 35,000 mark which is an obvious price but before this I think we have a beautiful leg up too that area of resistance. From here over the next few days I would be setting limits and trying to scale down to catch them perfect long positions. It's all up and down just wait until it turns around on a larger TF and bump down to the smaller TF to catch an opportunity.
TRADES I AM IN: CVXUSDT, BNBUSDT
Feel free to ask any questions, thanks guys.

Trading XAUUSD with Support and Resistance ZonesPicture this: the XAUUSD trading pair, Gold versus the US Dollar, is like a playground game of tug of war. On one side, you've got the bulls (buyers) yanking the rope, trying to pull the price up. On the other side, you've got the bears (sellers), doing their best to yank the price down.
Now, imagine there are lines drawn in the sand on each side: these are your support and resistance zones. They're like the castle walls in a game of Capture the Flag. The resistance zone is the bear's castle, a fortress where they gather strength and beat back the bull's offensive. The support zone, that's the bull's stronghold, where they rally and make a stand against the bears.
Now, we're going to zoom into our tug-of-war game with a telescope, getting a closer look at what's happening in the 15-minute intervals (the M15 time frame). Suddenly, we see the war isn't a continuous tug, but a series of fierce battles fought at the castles.
When the rope (price) reaches the bear's castle (resistance zone), the bears often successfully repel the bulls, causing the rope to recoil towards the bull's side (price goes down). Likewise, when the rope gets yanked to the bull's castle (support zone), the bulls gather their strength and push back, sending the rope back to the bear's side (price goes up).
But castles aren't impregnable. Sometimes, the attacking team (bulls at resistance, bears at support) breaches the castle walls, causing a chaotic scramble (price breakout). These breakouts are like the moments in a game when everyone gasps, drops their hotdogs, and scrambles to see what's going to happen next.
And because our game of tug-of-war isn't happening in a vacuum, outside influences—like that obnoxious park squirrel (unexpected market news)—can change the rules or shift the battleground lines (alter support and resistance zones).
Remember, this isn't a foolproof guide to winning the game—it's just one way to understand the strategies in play. And even though it's a game, we're playing with real money, so don't yank on that rope unless you can afford to fall in the mud. Always use your helmet (risk management strategies). And remember, sometimes, it's okay to let go of the rope and enjoy a sandwich (take breaks from trading).

RIOT $11.75 Price TargetGot in calls a little late but love how we held higher time frame support around 10:30 at $10.33. Expecting this to bounce to $11.75 later this week. Might be able to catch some calls on this one over $10.81 if you keep an eye out.

NQ Intraday Analysis 04/19/23Hi all, welcome back to a new morning :) Without going into the nitty-gritty, NQ is holding a major zone right now (simplified to the most recent area) and the market has extended almost 300 points within a day. I am expecting two scenarios at the opening area which will define how I act for the remainder of the day:
Scenario 1: Mean reversion long - Bulls are able to hold the major zone and end with a maximum target around 13300. Expect possible shorts around 13300 if shorts begin to hold major zones.
Scenario 2: Breakout short - Bulls cannot hold the major zone and the market breaks the low of the zone with a close. If bears can hold this zone on a retest, expect short scalps with the first minimum target around 13025. Risk of reversal long back above the major zone should be taken into account.
Of course, this is not financial advice and I have my own data used to validate this opening plan; please always perform your own research and judgement! Good luck and I hope all of you have a great day!

Bullish Gold For the Week Ahead!Since it's been a long time since my last post, I decided to Share more short term and with higher frequently posts, which contains more educational contents and Terylizing that is my own technique of analyzing market looking into three stages (News and fundamentals, sentiment of market and price action).
I wish we can have a good society here together pals.
You can also Follow me on FX baby pips there and Here I try to answer to different questions by newbie pals help them understand concepts better.
Now about the Gold:
With the news through the week which aren't expected to be hawkish for US dollar I expect to Gold continue to move upward but maybe with a slower rhythm in a uptrend (not a spike).
Please Don't take trades just on this analysis without a good risk management plan, Everything in life without proper risk management is Dangerous why should trading by apart of it. Also if you want to trade try to find best zones that you don't loose the chance but also trade at best prices.

YFIUSD: Bullish Consolidation Setup to Recover 3 Macro ZonesYFI right now is attempting to break above the zone it failed to break above before and appears to be heading into the level with much more strength than last time after a short term period of Consolidation. Now it is Broken above the 200 day SMA and getting ready to test the previously failed zone as support.
With this i'd expect it to complete a meaesured move of the Consolidation Flag, which would take it up 40%, after that it could pullback or be done; but the macro structure overall would kind of demand that; YFI in time, rise back up to $15,000 and maybe even $75,000 to complete the Squaring Up process.

RESULTS: Week of 1/30: SPY Supply and Demand LevelsLooks like we rejected the level and bounced at $400, all levels worked very cleanly.

WTI Oil Macro LevelsGood Evening Everyone,
Please watch the entire video to understand my break down and thesis.
As always trade safe set stops set takes and make sure you are always using appropriate risk for your RR.
Happy Trading + Safe Trading = Profits
I'll get back to posting more frequently if we can give this video some love!!!! Cheers

Adding Pivot Points to the Zone PredictorAfter a few years of development on the Zone Predictor indicator/strategy, it was suggested to add Pivot Points to show confluence between the trading Zones and the Pivot Points on a higher timeframe. By adding the Pivot Points, one can clearly see the levels at which there may be a better opportunity to trade the Zones around.
This chart is MNQ using 40 range bars (just to show 10 point moves in that market). The Zone Predictor provides the trading target areas and by showing the Pivot Points taken from a 15 min timeframe, it becomes more clear which are Zones that have greater potential.
Using different lookback lengths on the Pivot Points also shows where levels have been touched and breached multiple times.

CADCHFPrevious high broken
looking for pullback around 0.68600 level
wait for rejection and bullish impulsive PA for longs
up to next major zone

AUDCHFQuite simply looking for pullbacks to the 50 - 61.8 levels to trade this lower
Always react and adapt, nothing is ever guaranteed

USDCHFBoth 1H timeframe
Left chart we have zones, 50ema, trendline break, fib 50 - 61.8, support
If price pulls back to support and respects we could potentially have
3 - 4 confluences
1) support respected
2) price above 50ema
3) fib zone 50 - 61.8
3) trendline could be respected giving us a 3rd touch which aligns with support, 50ema and golden fib zone 50 - 61.8
Right chart we have an SMC concept markup
4H supply order block was mitigated friday so at present if price respects supply are in control so price could pull back
I anticipate price to reach the discounted order block to be mitigated and look for LTF confirmation to look to go long
3 confluences i would look for
1) 1h demand order block to mitigate and hold
2) 1h demand is in discounted (better pricing)
3) If LTF confirmation presents pull the trigger.
IFC (inneficiency), IMB (imbalance), FVG (fair value gap) are all the same thing it's basically an imbalance of price that could and probably be filled at a later date

Large volumes appeared. I expect a rebound from the support leveThe price has been in a downward movement for a long time. Large volumes appeared. Got a reaction from the level. An oblique level in the resistance was formed. I expect a rebound from the support and movement towards the boundaries of the inclined level. Goal - 0.477$

WTICOUSD Daily Bullish BlockSo the indicator created, which is in Beta, essentially detects trading blocks that act as areas of buying or selling with considerable amounts of accumulated volume .
Daily Bullish Block looks to be in play heading into next week. Suffice to say I will confirm the completion of block on Monday and trade accordingly.


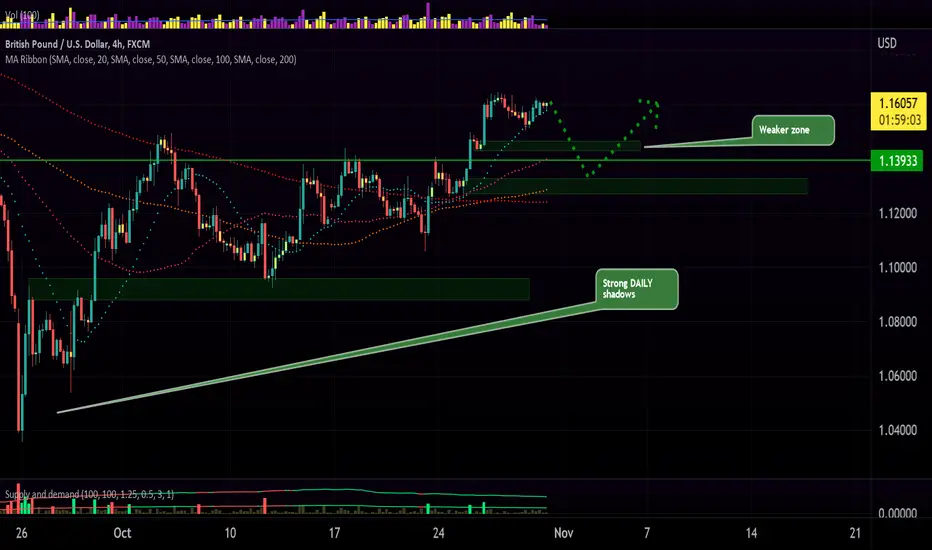
GBPUSD may reverse but continue rising for a while!I'll buy around the zones step by step. Long shadows in daily chart was a great sign of buyers power.
SOL - USDT 4HChart, resistance and support zonesHello everyone, let's take a look at the SOL versus USDT chart over the 4 hour timeframe. As you can see, the price is moving below the downtrend line.
Let's start by marking the support line and as you can see, when the price starts to fall, we have a support zone from $ 28.42 - $ 27.73.
Looking the other way around, the price is currently at the beginning of the resistance zone, which is between $ 28.95 - $ 30.25.
Looking at the CHOP indicator, we can see that in the 4-hour interval we have a lot of energy, and the MACD incidentator indicates that the blue line crosses the red one from the bottom, which confirms the trend shift into an uptrend.
